Bangladeshi vs Tongan Median Female Earnings
COMPARE
Bangladeshi
Tongan
Median Female Earnings
Median Female Earnings Comparison
Bangladeshis
Tongans
$35,960
MEDIAN FEMALE EARNINGS
0.0/ 100
METRIC RATING
289th/ 347
METRIC RANK
$38,288
MEDIAN FEMALE EARNINGS
5.1/ 100
METRIC RATING
233rd/ 347
METRIC RANK
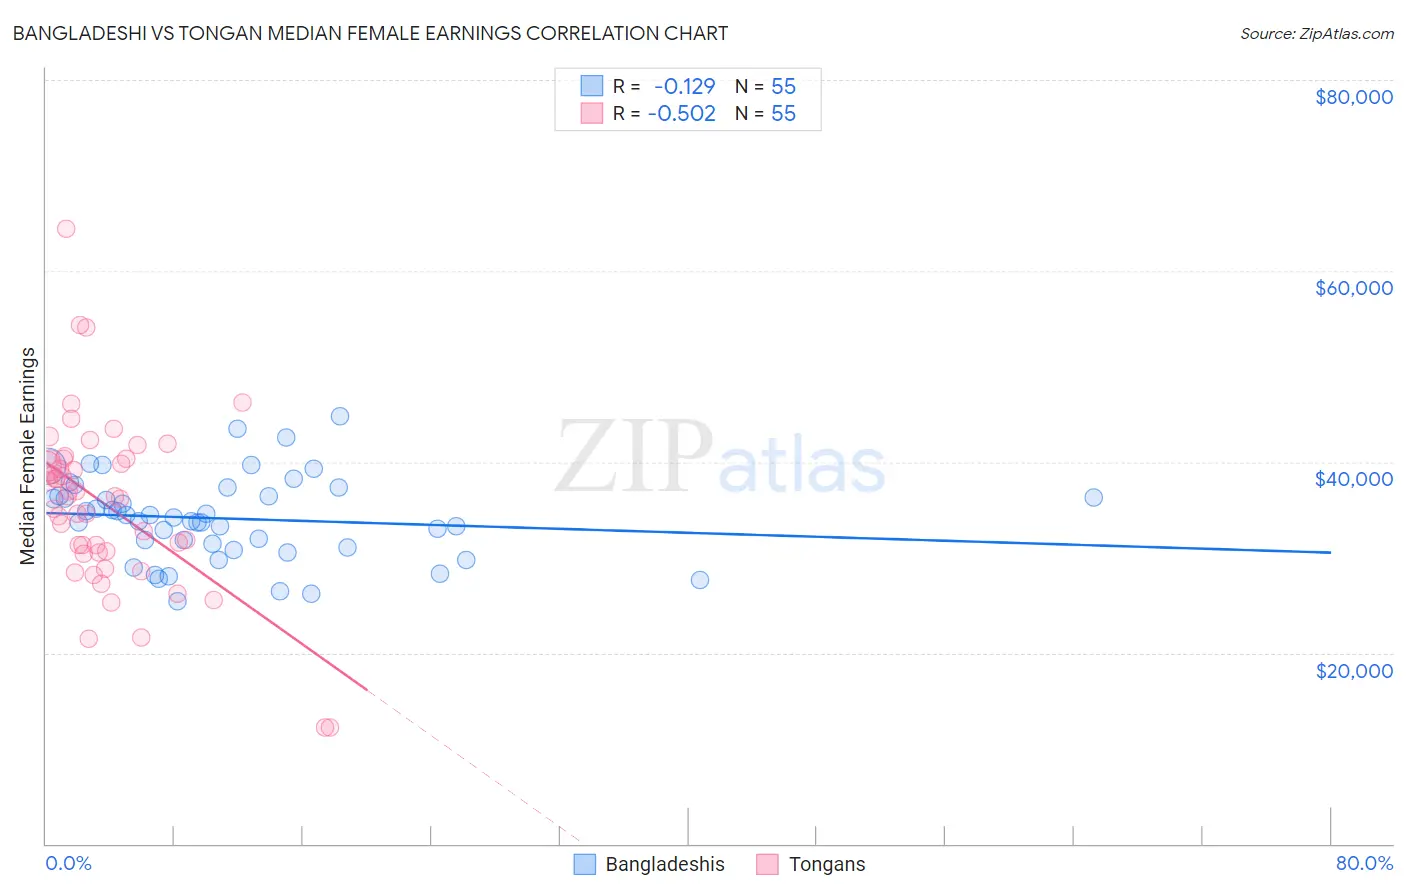
Bangladeshi vs Tongan Median Female Earnings Correlation Chart
The statistical analysis conducted on geographies consisting of 141,417,100 people shows a poor negative correlation between the proportion of Bangladeshis and median female earnings in the United States with a correlation coefficient (R) of -0.129 and weighted average of $35,960. Similarly, the statistical analysis conducted on geographies consisting of 102,899,109 people shows a substantial negative correlation between the proportion of Tongans and median female earnings in the United States with a correlation coefficient (R) of -0.502 and weighted average of $38,288, a difference of 6.5%.
Median Female Earnings Correlation Summary
| Measurement | Bangladeshi | Tongan |
| Minimum | $25,400 | $12,128 |
| Maximum | $44,719 | $64,435 |
| Range | $19,319 | $52,307 |
| Mean | $34,070 | $35,533 |
| Median | $34,114 | $36,346 |
| Interquartile 25% (IQ1) | $31,090 | $30,514 |
| Interquartile 75% (IQ3) | $36,435 | $40,343 |
| Interquartile Range (IQR) | $5,345 | $9,829 |
| Standard Deviation (Sample) | $4,364 | $9,124 |
| Standard Deviation (Population) | $4,325 | $9,040 |
Similar Demographics by Median Female Earnings
Demographics Similar to Bangladeshis by Median Female Earnings
In terms of median female earnings, the demographic groups most similar to Bangladeshis are Central American Indian ($35,930, a difference of 0.080%), Immigrants from Zaire ($36,017, a difference of 0.16%), Immigrants from Nicaragua ($36,023, a difference of 0.17%), Osage ($36,034, a difference of 0.21%), and Paiute ($36,056, a difference of 0.27%).
| Demographics | Rating | Rank | Median Female Earnings |
| Haitians | 0.1 /100 | #282 | Tragic $36,374 |
| Immigrants | Haiti | 0.1 /100 | #283 | Tragic $36,203 |
| Indonesians | 0.1 /100 | #284 | Tragic $36,140 |
| Paiute | 0.1 /100 | #285 | Tragic $36,056 |
| Osage | 0.0 /100 | #286 | Tragic $36,034 |
| Immigrants | Nicaragua | 0.0 /100 | #287 | Tragic $36,023 |
| Immigrants | Zaire | 0.0 /100 | #288 | Tragic $36,017 |
| Bangladeshis | 0.0 /100 | #289 | Tragic $35,960 |
| Central American Indians | 0.0 /100 | #290 | Tragic $35,930 |
| Blackfeet | 0.0 /100 | #291 | Tragic $35,864 |
| Americans | 0.0 /100 | #292 | Tragic $35,777 |
| Guatemalans | 0.0 /100 | #293 | Tragic $35,695 |
| Cheyenne | 0.0 /100 | #294 | Tragic $35,673 |
| Comanche | 0.0 /100 | #295 | Tragic $35,661 |
| Mexican American Indians | 0.0 /100 | #296 | Tragic $35,629 |
Demographics Similar to Tongans by Median Female Earnings
In terms of median female earnings, the demographic groups most similar to Tongans are Celtic ($38,283, a difference of 0.010%), Scandinavian ($38,306, a difference of 0.050%), Somali ($38,333, a difference of 0.12%), Basque ($38,352, a difference of 0.17%), and Sudanese ($38,215, a difference of 0.19%).
| Demographics | Rating | Rank | Median Female Earnings |
| French Canadians | 6.8 /100 | #226 | Tragic $38,436 |
| Scottish | 6.3 /100 | #227 | Tragic $38,397 |
| Sub-Saharan Africans | 6.2 /100 | #228 | Tragic $38,391 |
| Belgians | 6.1 /100 | #229 | Tragic $38,382 |
| Basques | 5.7 /100 | #230 | Tragic $38,352 |
| Somalis | 5.5 /100 | #231 | Tragic $38,333 |
| Scandinavians | 5.2 /100 | #232 | Tragic $38,306 |
| Tongans | 5.1 /100 | #233 | Tragic $38,288 |
| Celtics | 5.0 /100 | #234 | Tragic $38,283 |
| Sudanese | 4.4 /100 | #235 | Tragic $38,215 |
| Liberians | 4.4 /100 | #236 | Tragic $38,215 |
| Immigrants | Cabo Verde | 4.3 /100 | #237 | Tragic $38,208 |
| Alaska Natives | 4.3 /100 | #238 | Tragic $38,202 |
| English | 4.2 /100 | #239 | Tragic $38,196 |
| Finns | 4.0 /100 | #240 | Tragic $38,173 |