Immigrants from Jamaica vs Immigrants from North America Median Family Income
COMPARE
Immigrants from Jamaica
Immigrants from North America
Median Family Income
Median Family Income Comparison
Immigrants from Jamaica
Immigrants from North America
$89,268
MEDIAN FAMILY INCOME
0.1/ 100
METRIC RATING
277th/ 347
METRIC RANK
$112,151
MEDIAN FAMILY INCOME
99.2/ 100
METRIC RATING
81st/ 347
METRIC RANK
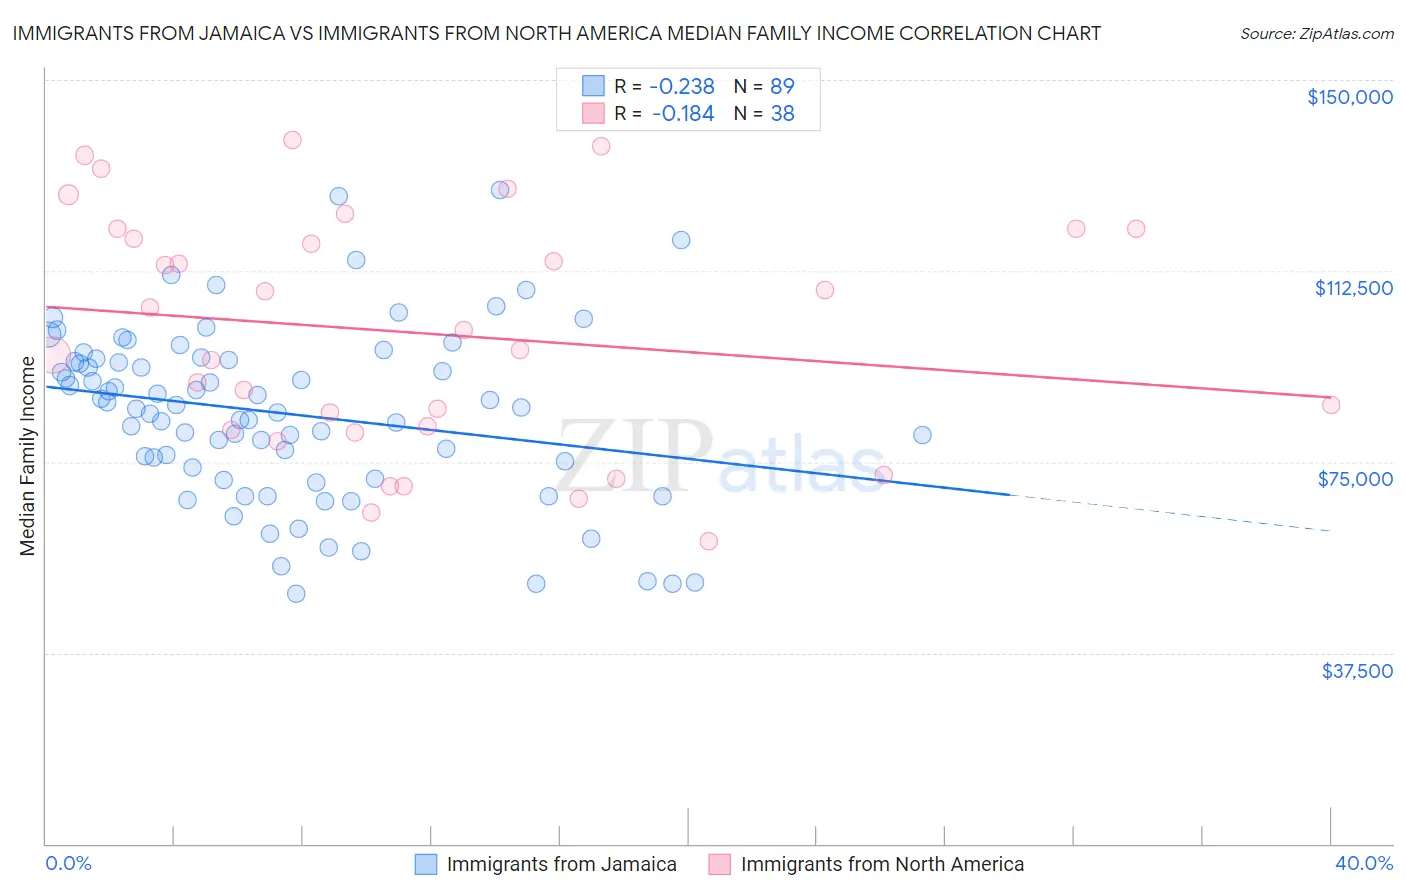
Immigrants from Jamaica vs Immigrants from North America Median Family Income Correlation Chart
The statistical analysis conducted on geographies consisting of 301,510,584 people shows a weak negative correlation between the proportion of Immigrants from Jamaica and median family income in the United States with a correlation coefficient (R) of -0.238 and weighted average of $89,268. Similarly, the statistical analysis conducted on geographies consisting of 462,006,603 people shows a poor negative correlation between the proportion of Immigrants from North America and median family income in the United States with a correlation coefficient (R) of -0.184 and weighted average of $112,151, a difference of 25.6%.
Median Family Income Correlation Summary
| Measurement | Immigrants from Jamaica | Immigrants from North America |
| Minimum | $49,200 | $59,444 |
| Maximum | $128,421 | $138,302 |
| Range | $79,221 | $78,858 |
| Mean | $84,512 | $100,295 |
| Median | $85,741 | $98,848 |
| Interquartile 25% (IQ1) | $72,845 | $81,159 |
| Interquartile 75% (IQ3) | $95,144 | $120,703 |
| Interquartile Range (IQR) | $22,299 | $39,544 |
| Standard Deviation (Sample) | $17,087 | $23,025 |
| Standard Deviation (Population) | $16,991 | $22,720 |
Similar Demographics by Median Family Income
Demographics Similar to Immigrants from Jamaica by Median Family Income
In terms of median family income, the demographic groups most similar to Immigrants from Jamaica are Immigrants from Zaire ($89,285, a difference of 0.020%), Immigrants from Grenada ($89,249, a difference of 0.020%), Immigrants from Belize ($89,197, a difference of 0.080%), British West Indian ($88,987, a difference of 0.32%), and Blackfeet ($88,717, a difference of 0.62%).
| Demographics | Rating | Rank | Median Family Income |
| Jamaicans | 0.2 /100 | #270 | Tragic $90,581 |
| Iroquois | 0.2 /100 | #271 | Tragic $90,543 |
| Immigrants | Liberia | 0.2 /100 | #272 | Tragic $90,450 |
| Immigrants | Micronesia | 0.2 /100 | #273 | Tragic $90,345 |
| Spanish Americans | 0.2 /100 | #274 | Tragic $90,322 |
| Immigrants | St. Vincent and the Grenadines | 0.2 /100 | #275 | Tragic $90,094 |
| Immigrants | Zaire | 0.1 /100 | #276 | Tragic $89,285 |
| Immigrants | Jamaica | 0.1 /100 | #277 | Tragic $89,268 |
| Immigrants | Grenada | 0.1 /100 | #278 | Tragic $89,249 |
| Immigrants | Belize | 0.1 /100 | #279 | Tragic $89,197 |
| British West Indians | 0.1 /100 | #280 | Tragic $88,987 |
| Blackfeet | 0.1 /100 | #281 | Tragic $88,717 |
| Comanche | 0.1 /100 | #282 | Tragic $88,556 |
| Bangladeshis | 0.1 /100 | #283 | Tragic $88,358 |
| Indonesians | 0.1 /100 | #284 | Tragic $88,301 |
Demographics Similar to Immigrants from North America by Median Family Income
In terms of median family income, the demographic groups most similar to Immigrants from North America are Immigrants from England ($112,038, a difference of 0.10%), Immigrants from Croatia ($112,323, a difference of 0.15%), Immigrants from Canada ($112,374, a difference of 0.20%), Italian ($112,372, a difference of 0.20%), and Immigrants from Eastern Europe ($112,527, a difference of 0.33%).
| Demographics | Rating | Rank | Median Family Income |
| Immigrants | Italy | 99.4 /100 | #74 | Exceptional $112,848 |
| Immigrants | Western Europe | 99.4 /100 | #75 | Exceptional $112,688 |
| Argentineans | 99.4 /100 | #76 | Exceptional $112,665 |
| Immigrants | Eastern Europe | 99.4 /100 | #77 | Exceptional $112,527 |
| Immigrants | Canada | 99.3 /100 | #78 | Exceptional $112,374 |
| Italians | 99.3 /100 | #79 | Exceptional $112,372 |
| Immigrants | Croatia | 99.3 /100 | #80 | Exceptional $112,323 |
| Immigrants | North America | 99.2 /100 | #81 | Exceptional $112,151 |
| Immigrants | England | 99.2 /100 | #82 | Exceptional $112,038 |
| Immigrants | Egypt | 99.0 /100 | #83 | Exceptional $111,689 |
| Immigrants | Hungary | 98.8 /100 | #84 | Exceptional $111,378 |
| Croatians | 98.8 /100 | #85 | Exceptional $111,370 |
| Ukrainians | 98.8 /100 | #86 | Exceptional $111,368 |
| Austrians | 98.8 /100 | #87 | Exceptional $111,306 |
| Romanians | 98.8 /100 | #88 | Exceptional $111,243 |