Immigrants from Honduras vs Yup'ik Median Male Earnings
COMPARE
Immigrants from Honduras
Yup'ik
Median Male Earnings
Median Male Earnings Comparison
Immigrants from Honduras
Yup'ik
$45,787
MEDIAN MALE EARNINGS
0.0/ 100
METRIC RATING
320th/ 347
METRIC RANK
$39,504
MEDIAN MALE EARNINGS
0.0/ 100
METRIC RATING
347th/ 347
METRIC RANK
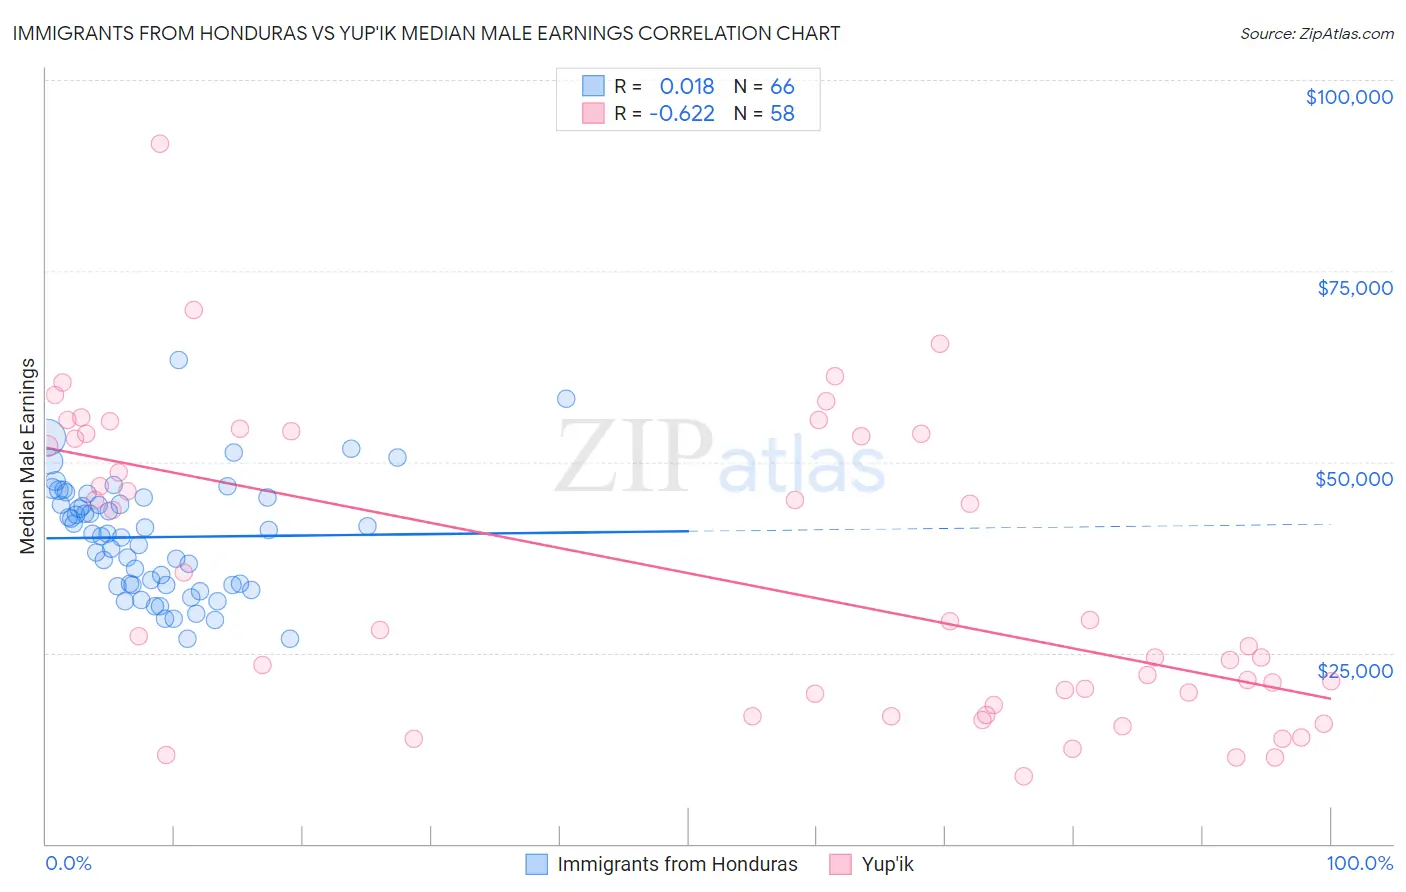
Immigrants from Honduras vs Yup'ik Median Male Earnings Correlation Chart
The statistical analysis conducted on geographies consisting of 322,554,949 people shows no correlation between the proportion of Immigrants from Honduras and median male earnings in the United States with a correlation coefficient (R) of 0.018 and weighted average of $45,787. Similarly, the statistical analysis conducted on geographies consisting of 39,949,304 people shows a significant negative correlation between the proportion of Yup'ik and median male earnings in the United States with a correlation coefficient (R) of -0.622 and weighted average of $39,504, a difference of 15.9%.
Median Male Earnings Correlation Summary
| Measurement | Immigrants from Honduras | Yup'ik |
| Minimum | $26,786 | $8,859 |
| Maximum | $63,286 | $91,667 |
| Range | $36,500 | $82,808 |
| Mean | $40,153 | $35,016 |
| Median | $40,629 | $27,549 |
| Interquartile 25% (IQ1) | $33,830 | $18,125 |
| Interquartile 75% (IQ3) | $45,376 | $53,694 |
| Interquartile Range (IQR) | $11,546 | $35,569 |
| Standard Deviation (Sample) | $7,556 | $19,492 |
| Standard Deviation (Population) | $7,498 | $19,323 |
Similar Demographics by Median Male Earnings
Demographics Similar to Immigrants from Honduras by Median Male Earnings
In terms of median male earnings, the demographic groups most similar to Immigrants from Honduras are Haitian ($45,903, a difference of 0.25%), Fijian ($45,607, a difference of 0.39%), Sioux ($45,566, a difference of 0.48%), Immigrants from Central America ($45,538, a difference of 0.55%), and Black/African American ($45,523, a difference of 0.58%).
| Demographics | Rating | Rank | Median Male Earnings |
| Hondurans | 0.0 /100 | #313 | Tragic $46,374 |
| Chippewa | 0.0 /100 | #314 | Tragic $46,368 |
| Immigrants | Guatemala | 0.0 /100 | #315 | Tragic $46,244 |
| Immigrants | Caribbean | 0.0 /100 | #316 | Tragic $46,193 |
| Mexicans | 0.0 /100 | #317 | Tragic $46,147 |
| Cheyenne | 0.0 /100 | #318 | Tragic $46,062 |
| Haitians | 0.0 /100 | #319 | Tragic $45,903 |
| Immigrants | Honduras | 0.0 /100 | #320 | Tragic $45,787 |
| Fijians | 0.0 /100 | #321 | Tragic $45,607 |
| Sioux | 0.0 /100 | #322 | Tragic $45,566 |
| Immigrants | Central America | 0.0 /100 | #323 | Tragic $45,538 |
| Blacks/African Americans | 0.0 /100 | #324 | Tragic $45,523 |
| Yuman | 0.0 /100 | #325 | Tragic $45,446 |
| Immigrants | Haiti | 0.0 /100 | #326 | Tragic $45,266 |
| Immigrants | Bahamas | 0.0 /100 | #327 | Tragic $45,176 |
Demographics Similar to Yup'ik by Median Male Earnings
In terms of median male earnings, the demographic groups most similar to Yup'ik are Tohono O'odham ($39,543, a difference of 0.10%), Puerto Rican ($40,071, a difference of 1.4%), Pueblo ($41,314, a difference of 4.6%), Lumbee ($41,715, a difference of 5.6%), and Arapaho ($41,758, a difference of 5.7%).
| Demographics | Rating | Rank | Median Male Earnings |
| Immigrants | Congo | 0.0 /100 | #333 | Tragic $44,204 |
| Immigrants | Yemen | 0.0 /100 | #334 | Tragic $44,083 |
| Spanish American Indians | 0.0 /100 | #335 | Tragic $44,010 |
| Immigrants | Cuba | 0.0 /100 | #336 | Tragic $43,461 |
| Menominee | 0.0 /100 | #337 | Tragic $42,581 |
| Crow | 0.0 /100 | #338 | Tragic $42,434 |
| Pima | 0.0 /100 | #339 | Tragic $42,357 |
| Navajo | 0.0 /100 | #340 | Tragic $42,098 |
| Hopi | 0.0 /100 | #341 | Tragic $42,060 |
| Arapaho | 0.0 /100 | #342 | Tragic $41,758 |
| Lumbee | 0.0 /100 | #343 | Tragic $41,715 |
| Pueblo | 0.0 /100 | #344 | Tragic $41,314 |
| Puerto Ricans | 0.0 /100 | #345 | Tragic $40,071 |
| Tohono O'odham | 0.0 /100 | #346 | Tragic $39,543 |
| Yup'ik | 0.0 /100 | #347 | Tragic $39,504 |