Immigrants from Grenada vs Immigrants from Turkey Householder Income Ages 25 - 44 years
COMPARE
Immigrants from Grenada
Immigrants from Turkey
Householder Income Ages 25 - 44 years
Householder Income Ages 25 - 44 years Comparison
Immigrants from Grenada
Immigrants from Turkey
$88,311
HOUSEHOLDER INCOME AGES 25 - 44 YEARS
3.0/ 100
METRIC RATING
231st/ 347
METRIC RANK
$107,258
HOUSEHOLDER INCOME AGES 25 - 44 YEARS
99.9/ 100
METRIC RATING
49th/ 347
METRIC RANK
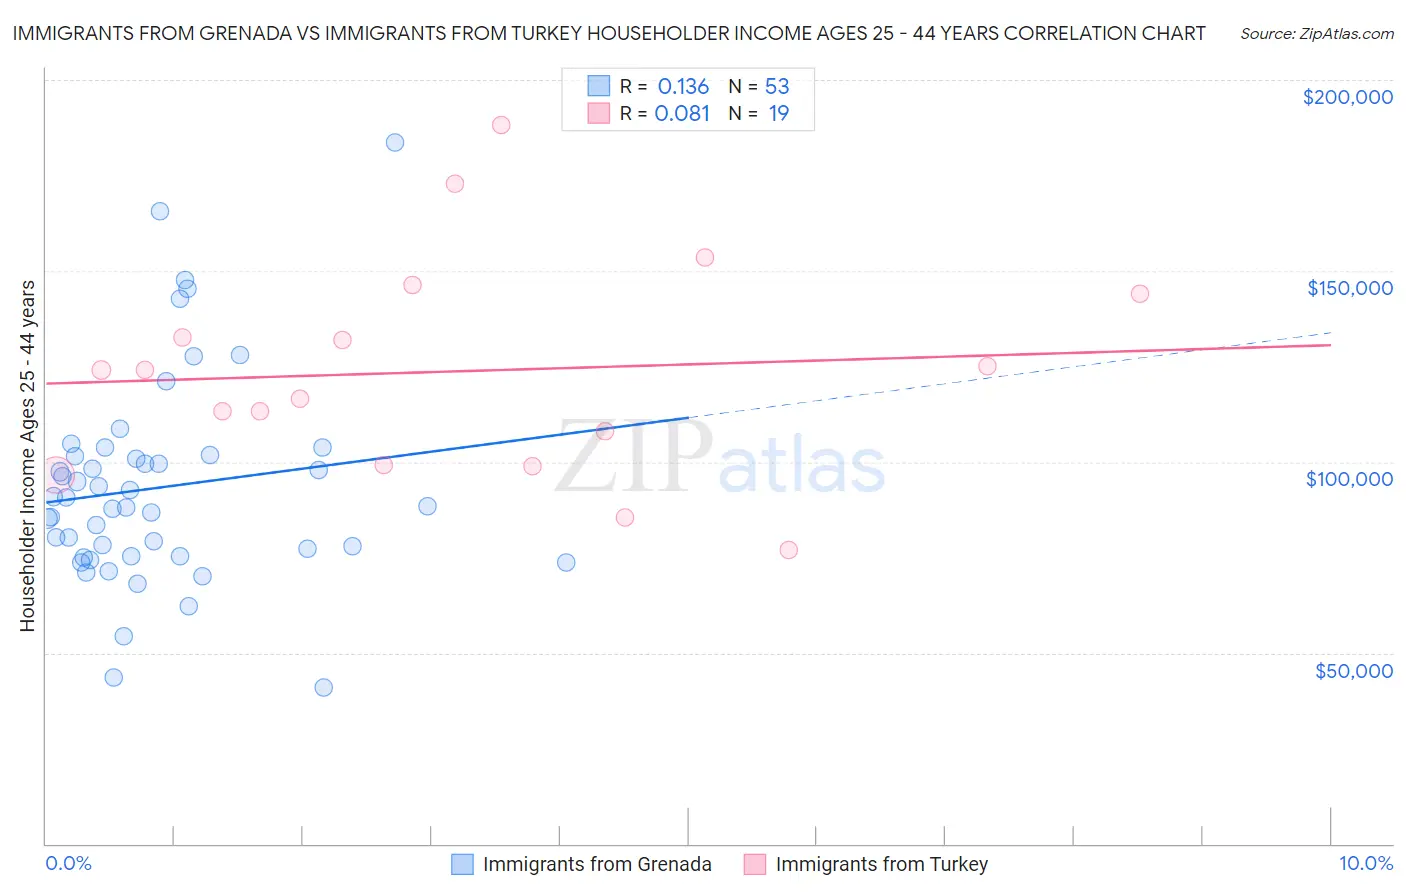
Immigrants from Grenada vs Immigrants from Turkey Householder Income Ages 25 - 44 years Correlation Chart
The statistical analysis conducted on geographies consisting of 67,165,379 people shows a poor positive correlation between the proportion of Immigrants from Grenada and household income with householder between the ages 25 and 44 in the United States with a correlation coefficient (R) of 0.136 and weighted average of $88,311. Similarly, the statistical analysis conducted on geographies consisting of 222,801,410 people shows a slight positive correlation between the proportion of Immigrants from Turkey and household income with householder between the ages 25 and 44 in the United States with a correlation coefficient (R) of 0.081 and weighted average of $107,258, a difference of 21.4%.
Householder Income Ages 25 - 44 years Correlation Summary
| Measurement | Immigrants from Grenada | Immigrants from Turkey |
| Minimum | $40,942 | $76,806 |
| Maximum | $183,750 | $188,366 |
| Range | $142,808 | $111,560 |
| Mean | $93,291 | $123,727 |
| Median | $88,464 | $124,014 |
| Interquartile 25% (IQ1) | $75,281 | $99,024 |
| Interquartile 75% (IQ3) | $101,579 | $144,167 |
| Interquartile Range (IQR) | $26,298 | $45,143 |
| Standard Deviation (Sample) | $27,452 | $28,597 |
| Standard Deviation (Population) | $27,192 | $27,834 |
Similar Demographics by Householder Income Ages 25 - 44 years
Demographics Similar to Immigrants from Grenada by Householder Income Ages 25 - 44 years
In terms of householder income ages 25 - 44 years, the demographic groups most similar to Immigrants from Grenada are Nonimmigrants ($88,301, a difference of 0.010%), Malaysian ($88,291, a difference of 0.020%), Venezuelan ($88,232, a difference of 0.090%), Bermudan ($88,231, a difference of 0.090%), and Immigrants from Cameroon ($88,214, a difference of 0.11%).
| Demographics | Rating | Rank | Householder Income Ages 25 - 44 years |
| Barbadians | 5.9 /100 | #224 | Tragic $89,565 |
| Immigrants | Panama | 5.5 /100 | #225 | Tragic $89,451 |
| Immigrants | Iraq | 5.5 /100 | #226 | Tragic $89,444 |
| Immigrants | St. Vincent and the Grenadines | 4.1 /100 | #227 | Tragic $88,888 |
| Immigrants | Bosnia and Herzegovina | 4.0 /100 | #228 | Tragic $88,819 |
| Immigrants | Barbados | 3.7 /100 | #229 | Tragic $88,687 |
| Alaskan Athabascans | 3.3 /100 | #230 | Tragic $88,446 |
| Immigrants | Grenada | 3.0 /100 | #231 | Tragic $88,311 |
| Immigrants | Nonimmigrants | 3.0 /100 | #232 | Tragic $88,301 |
| Malaysians | 3.0 /100 | #233 | Tragic $88,291 |
| Venezuelans | 2.9 /100 | #234 | Tragic $88,232 |
| Bermudans | 2.9 /100 | #235 | Tragic $88,231 |
| Immigrants | Cameroon | 2.9 /100 | #236 | Tragic $88,214 |
| Salvadorans | 2.8 /100 | #237 | Tragic $88,198 |
| Alaska Natives | 2.6 /100 | #238 | Tragic $88,018 |
Demographics Similar to Immigrants from Turkey by Householder Income Ages 25 - 44 years
In terms of householder income ages 25 - 44 years, the demographic groups most similar to Immigrants from Turkey are Estonian ($107,269, a difference of 0.010%), Bulgarian ($107,264, a difference of 0.010%), Cambodian ($107,148, a difference of 0.10%), Immigrants from Belarus ($107,393, a difference of 0.13%), and Israeli ($107,579, a difference of 0.30%).
| Demographics | Rating | Rank | Householder Income Ages 25 - 44 years |
| Australians | 99.9 /100 | #42 | Exceptional $107,912 |
| Immigrants | Malaysia | 99.9 /100 | #43 | Exceptional $107,650 |
| Immigrants | Indonesia | 99.9 /100 | #44 | Exceptional $107,627 |
| Israelis | 99.9 /100 | #45 | Exceptional $107,579 |
| Immigrants | Belarus | 99.9 /100 | #46 | Exceptional $107,393 |
| Estonians | 99.9 /100 | #47 | Exceptional $107,269 |
| Bulgarians | 99.9 /100 | #48 | Exceptional $107,264 |
| Immigrants | Turkey | 99.9 /100 | #49 | Exceptional $107,258 |
| Cambodians | 99.9 /100 | #50 | Exceptional $107,148 |
| Immigrants | Czechoslovakia | 99.9 /100 | #51 | Exceptional $106,888 |
| Immigrants | Europe | 99.9 /100 | #52 | Exceptional $106,817 |
| Immigrants | Norway | 99.9 /100 | #53 | Exceptional $106,629 |
| Paraguayans | 99.9 /100 | #54 | Exceptional $106,615 |
| Greeks | 99.9 /100 | #55 | Exceptional $106,457 |
| Immigrants | Pakistan | 99.8 /100 | #56 | Exceptional $106,129 |