Belizean vs Immigrants from Turkey Householder Income Ages 25 - 44 years
COMPARE
Belizean
Immigrants from Turkey
Householder Income Ages 25 - 44 years
Householder Income Ages 25 - 44 years Comparison
Belizeans
Immigrants from Turkey
$84,534
HOUSEHOLDER INCOME AGES 25 - 44 YEARS
0.4/ 100
METRIC RATING
263rd/ 347
METRIC RANK
$107,258
HOUSEHOLDER INCOME AGES 25 - 44 YEARS
99.9/ 100
METRIC RATING
49th/ 347
METRIC RANK
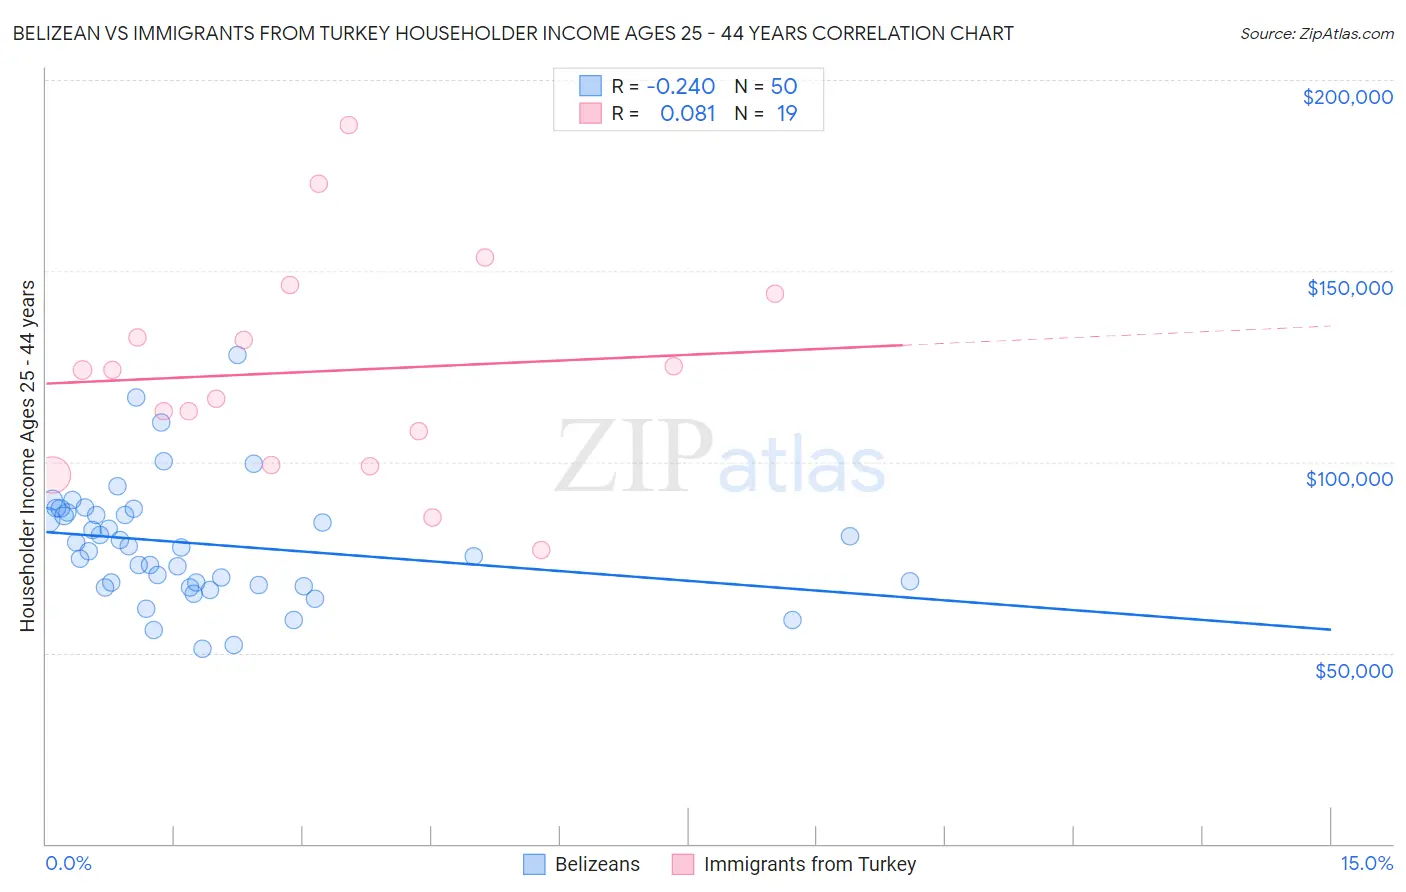
Belizean vs Immigrants from Turkey Householder Income Ages 25 - 44 years Correlation Chart
The statistical analysis conducted on geographies consisting of 144,109,917 people shows a weak negative correlation between the proportion of Belizeans and household income with householder between the ages 25 and 44 in the United States with a correlation coefficient (R) of -0.240 and weighted average of $84,534. Similarly, the statistical analysis conducted on geographies consisting of 222,801,410 people shows a slight positive correlation between the proportion of Immigrants from Turkey and household income with householder between the ages 25 and 44 in the United States with a correlation coefficient (R) of 0.081 and weighted average of $107,258, a difference of 26.9%.
Householder Income Ages 25 - 44 years Correlation Summary
| Measurement | Belizean | Immigrants from Turkey |
| Minimum | $50,928 | $76,806 |
| Maximum | $128,125 | $188,366 |
| Range | $77,197 | $111,560 |
| Mean | $78,550 | $123,727 |
| Median | $77,650 | $124,014 |
| Interquartile 25% (IQ1) | $67,791 | $99,024 |
| Interquartile 75% (IQ3) | $86,760 | $144,167 |
| Interquartile Range (IQR) | $18,970 | $45,143 |
| Standard Deviation (Sample) | $15,455 | $28,597 |
| Standard Deviation (Population) | $15,299 | $27,834 |
Similar Demographics by Householder Income Ages 25 - 44 years
Demographics Similar to Belizeans by Householder Income Ages 25 - 44 years
In terms of householder income ages 25 - 44 years, the demographic groups most similar to Belizeans are Cree ($84,574, a difference of 0.050%), Osage ($84,461, a difference of 0.090%), Inupiat ($84,619, a difference of 0.10%), Sudanese ($84,401, a difference of 0.16%), and Immigrants from Cabo Verde ($84,304, a difference of 0.27%).
| Demographics | Rating | Rank | Householder Income Ages 25 - 44 years |
| Central Americans | 0.5 /100 | #256 | Tragic $85,144 |
| Mexican American Indians | 0.5 /100 | #257 | Tragic $85,066 |
| Immigrants | Nicaragua | 0.5 /100 | #258 | Tragic $84,914 |
| Immigrants | Senegal | 0.5 /100 | #259 | Tragic $84,848 |
| Americans | 0.4 /100 | #260 | Tragic $84,791 |
| Inupiat | 0.4 /100 | #261 | Tragic $84,619 |
| Cree | 0.4 /100 | #262 | Tragic $84,574 |
| Belizeans | 0.4 /100 | #263 | Tragic $84,534 |
| Osage | 0.4 /100 | #264 | Tragic $84,461 |
| Sudanese | 0.4 /100 | #265 | Tragic $84,401 |
| Immigrants | Cabo Verde | 0.3 /100 | #266 | Tragic $84,304 |
| Hmong | 0.3 /100 | #267 | Tragic $84,258 |
| Sub-Saharan Africans | 0.3 /100 | #268 | Tragic $84,235 |
| Spanish American Indians | 0.3 /100 | #269 | Tragic $84,085 |
| Jamaicans | 0.3 /100 | #270 | Tragic $83,933 |
Demographics Similar to Immigrants from Turkey by Householder Income Ages 25 - 44 years
In terms of householder income ages 25 - 44 years, the demographic groups most similar to Immigrants from Turkey are Estonian ($107,269, a difference of 0.010%), Bulgarian ($107,264, a difference of 0.010%), Cambodian ($107,148, a difference of 0.10%), Immigrants from Belarus ($107,393, a difference of 0.13%), and Israeli ($107,579, a difference of 0.30%).
| Demographics | Rating | Rank | Householder Income Ages 25 - 44 years |
| Australians | 99.9 /100 | #42 | Exceptional $107,912 |
| Immigrants | Malaysia | 99.9 /100 | #43 | Exceptional $107,650 |
| Immigrants | Indonesia | 99.9 /100 | #44 | Exceptional $107,627 |
| Israelis | 99.9 /100 | #45 | Exceptional $107,579 |
| Immigrants | Belarus | 99.9 /100 | #46 | Exceptional $107,393 |
| Estonians | 99.9 /100 | #47 | Exceptional $107,269 |
| Bulgarians | 99.9 /100 | #48 | Exceptional $107,264 |
| Immigrants | Turkey | 99.9 /100 | #49 | Exceptional $107,258 |
| Cambodians | 99.9 /100 | #50 | Exceptional $107,148 |
| Immigrants | Czechoslovakia | 99.9 /100 | #51 | Exceptional $106,888 |
| Immigrants | Europe | 99.9 /100 | #52 | Exceptional $106,817 |
| Immigrants | Norway | 99.9 /100 | #53 | Exceptional $106,629 |
| Paraguayans | 99.9 /100 | #54 | Exceptional $106,615 |
| Greeks | 99.9 /100 | #55 | Exceptional $106,457 |
| Immigrants | Pakistan | 99.8 /100 | #56 | Exceptional $106,129 |