Immigrants from Ecuador vs Macedonian Median Family Income
COMPARE
Immigrants from Ecuador
Macedonian
Median Family Income
Median Family Income Comparison
Immigrants from Ecuador
Macedonians
$92,837
MEDIAN FAMILY INCOME
0.7/ 100
METRIC RATING
249th/ 347
METRIC RANK
$109,668
MEDIAN FAMILY INCOME
97.3/ 100
METRIC RATING
100th/ 347
METRIC RANK
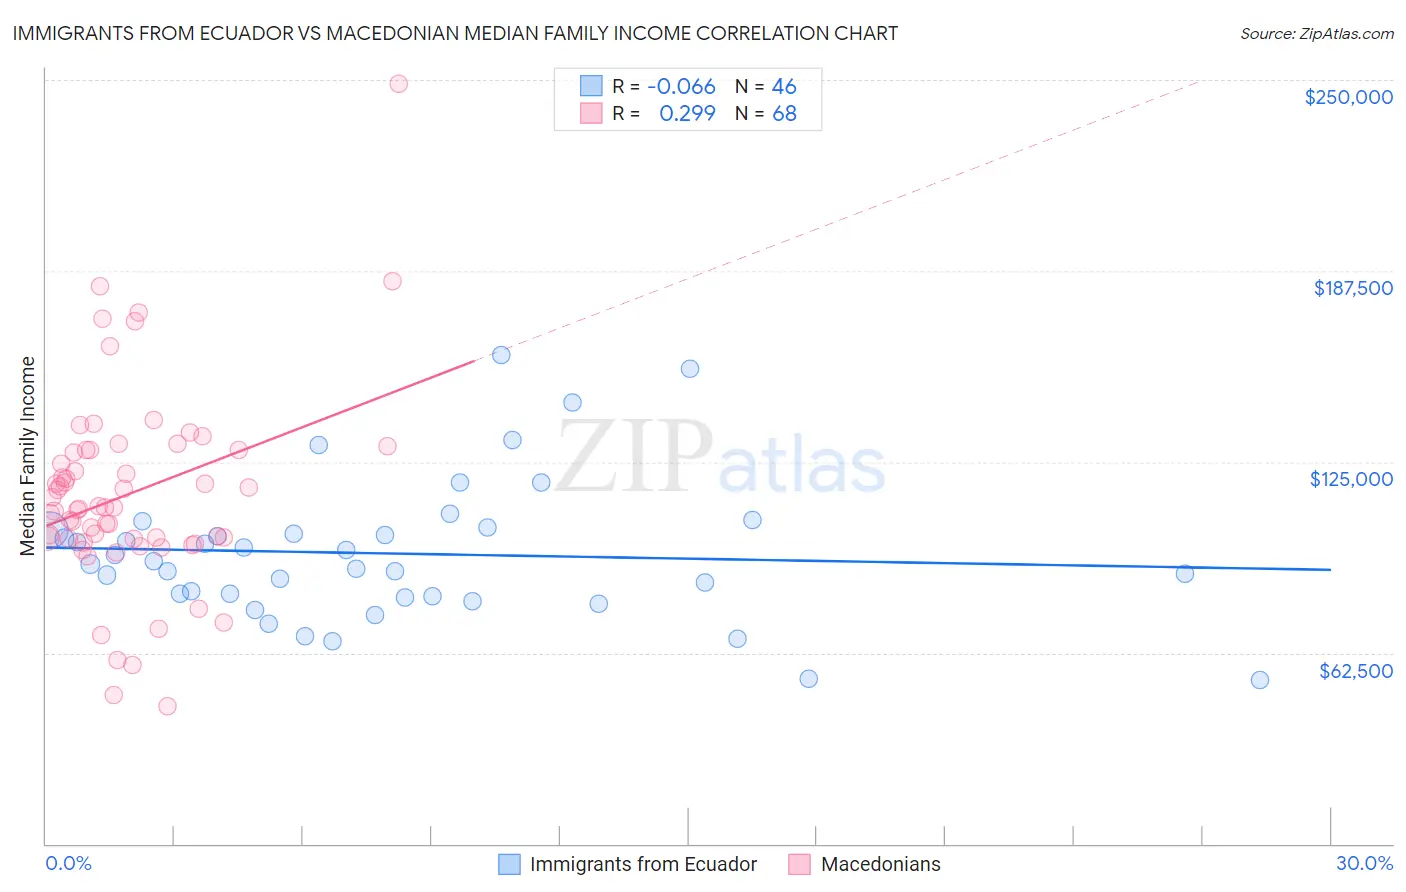
Immigrants from Ecuador vs Macedonian Median Family Income Correlation Chart
The statistical analysis conducted on geographies consisting of 270,846,171 people shows a slight negative correlation between the proportion of Immigrants from Ecuador and median family income in the United States with a correlation coefficient (R) of -0.066 and weighted average of $92,837. Similarly, the statistical analysis conducted on geographies consisting of 132,508,539 people shows a weak positive correlation between the proportion of Macedonians and median family income in the United States with a correlation coefficient (R) of 0.299 and weighted average of $109,668, a difference of 18.1%.
Median Family Income Correlation Summary
| Measurement | Immigrants from Ecuador | Macedonian |
| Minimum | $53,750 | $44,804 |
| Maximum | $159,896 | $248,750 |
| Range | $106,146 | $203,946 |
| Mean | $95,020 | $114,576 |
| Median | $92,088 | $110,196 |
| Interquartile 25% (IQ1) | $80,966 | $99,876 |
| Interquartile 75% (IQ3) | $102,770 | $128,750 |
| Interquartile Range (IQR) | $21,804 | $28,874 |
| Standard Deviation (Sample) | $22,898 | $32,654 |
| Standard Deviation (Population) | $22,647 | $32,413 |
Similar Demographics by Median Family Income
Demographics Similar to Immigrants from Ecuador by Median Family Income
In terms of median family income, the demographic groups most similar to Immigrants from Ecuador are French American Indian ($92,872, a difference of 0.040%), Immigrants from Senegal ($92,912, a difference of 0.080%), West Indian ($92,765, a difference of 0.080%), Immigrants from Somalia ($92,609, a difference of 0.25%), and Immigrants from El Salvador ($92,545, a difference of 0.32%).
| Demographics | Rating | Rank | Median Family Income |
| Barbadians | 1.1 /100 | #242 | Tragic $93,919 |
| German Russians | 1.1 /100 | #243 | Tragic $93,858 |
| Sub-Saharan Africans | 1.0 /100 | #244 | Tragic $93,748 |
| Immigrants | Middle Africa | 1.0 /100 | #245 | Tragic $93,593 |
| Guyanese | 0.9 /100 | #246 | Tragic $93,373 |
| Immigrants | Senegal | 0.7 /100 | #247 | Tragic $92,912 |
| French American Indians | 0.7 /100 | #248 | Tragic $92,872 |
| Immigrants | Ecuador | 0.7 /100 | #249 | Tragic $92,837 |
| West Indians | 0.6 /100 | #250 | Tragic $92,765 |
| Immigrants | Somalia | 0.6 /100 | #251 | Tragic $92,609 |
| Immigrants | El Salvador | 0.6 /100 | #252 | Tragic $92,545 |
| Immigrants | Guyana | 0.6 /100 | #253 | Tragic $92,513 |
| Immigrants | Barbados | 0.5 /100 | #254 | Tragic $92,419 |
| Immigrants | Laos | 0.5 /100 | #255 | Tragic $92,239 |
| Nicaraguans | 0.5 /100 | #256 | Tragic $92,231 |
Demographics Similar to Macedonians by Median Family Income
In terms of median family income, the demographic groups most similar to Macedonians are Armenian ($109,692, a difference of 0.020%), Immigrants from Ukraine ($109,645, a difference of 0.020%), Assyrian/Chaldean/Syriac ($109,622, a difference of 0.040%), Immigrants from Kuwait ($109,731, a difference of 0.060%), and Jordanian ($109,865, a difference of 0.18%).
| Demographics | Rating | Rank | Median Family Income |
| Immigrants | Kazakhstan | 97.8 /100 | #93 | Exceptional $110,137 |
| Koreans | 97.8 /100 | #94 | Exceptional $110,103 |
| Zimbabweans | 97.7 /100 | #95 | Exceptional $110,011 |
| Immigrants | Moldova | 97.7 /100 | #96 | Exceptional $109,975 |
| Jordanians | 97.5 /100 | #97 | Exceptional $109,865 |
| Immigrants | Kuwait | 97.4 /100 | #98 | Exceptional $109,731 |
| Armenians | 97.3 /100 | #99 | Exceptional $109,692 |
| Macedonians | 97.3 /100 | #100 | Exceptional $109,668 |
| Immigrants | Ukraine | 97.2 /100 | #101 | Exceptional $109,645 |
| Assyrians/Chaldeans/Syriacs | 97.2 /100 | #102 | Exceptional $109,622 |
| Immigrants | Brazil | 96.9 /100 | #103 | Exceptional $109,418 |
| Palestinians | 96.9 /100 | #104 | Exceptional $109,413 |
| Syrians | 96.7 /100 | #105 | Exceptional $109,299 |
| Albanians | 96.4 /100 | #106 | Exceptional $109,136 |
| Immigrants | North Macedonia | 96.4 /100 | #107 | Exceptional $109,136 |