Immigrants from Eastern Africa vs Vietnamese Median Male Earnings
COMPARE
Immigrants from Eastern Africa
Vietnamese
Median Male Earnings
Median Male Earnings Comparison
Immigrants from Eastern Africa
Vietnamese
$53,713
MEDIAN MALE EARNINGS
31.8/ 100
METRIC RATING
188th/ 347
METRIC RANK
$52,525
MEDIAN MALE EARNINGS
12.7/ 100
METRIC RATING
207th/ 347
METRIC RANK
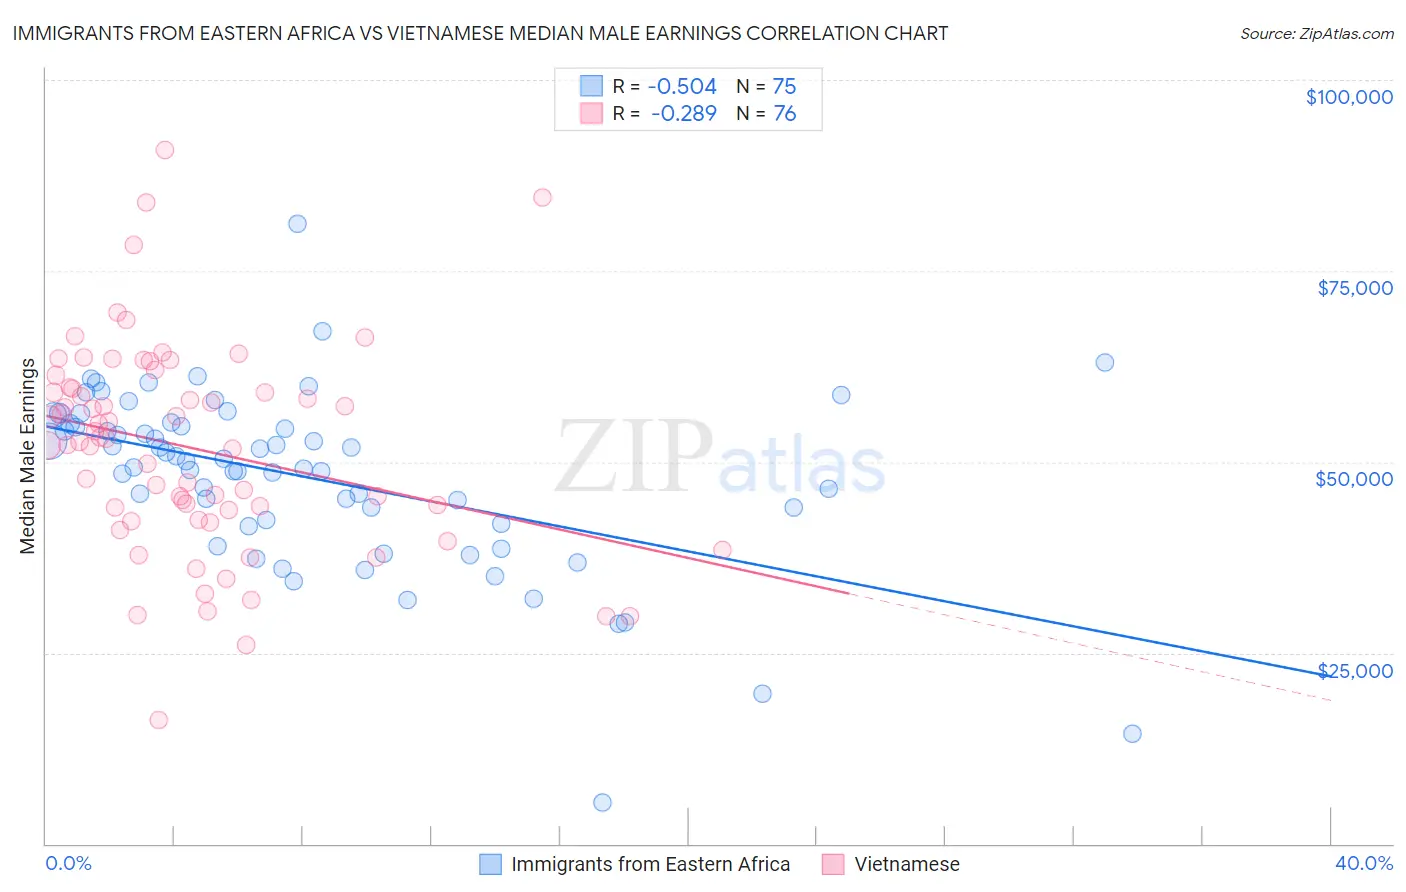
Immigrants from Eastern Africa vs Vietnamese Median Male Earnings Correlation Chart
The statistical analysis conducted on geographies consisting of 355,094,627 people shows a substantial negative correlation between the proportion of Immigrants from Eastern Africa and median male earnings in the United States with a correlation coefficient (R) of -0.504 and weighted average of $53,713. Similarly, the statistical analysis conducted on geographies consisting of 170,734,633 people shows a weak negative correlation between the proportion of Vietnamese and median male earnings in the United States with a correlation coefficient (R) of -0.289 and weighted average of $52,525, a difference of 2.3%.
Median Male Earnings Correlation Summary
| Measurement | Immigrants from Eastern Africa | Vietnamese |
| Minimum | $5,481 | $16,146 |
| Maximum | $81,191 | $90,827 |
| Range | $75,710 | $74,681 |
| Mean | $47,968 | $51,791 |
| Median | $50,087 | $52,846 |
| Interquartile 25% (IQ1) | $41,922 | $43,003 |
| Interquartile 75% (IQ3) | $54,936 | $59,635 |
| Interquartile Range (IQR) | $13,014 | $16,633 |
| Standard Deviation (Sample) | $11,795 | $13,801 |
| Standard Deviation (Population) | $11,716 | $13,710 |
Demographics Similar to Immigrants from Eastern Africa and Vietnamese by Median Male Earnings
In terms of median male earnings, the demographic groups most similar to Immigrants from Eastern Africa are Immigrants from Eritrea ($53,715, a difference of 0.0%), Puget Sound Salish ($53,704, a difference of 0.020%), Uruguayan ($53,680, a difference of 0.060%), Guamanian/Chamorro ($53,661, a difference of 0.10%), and Scotch-Irish ($53,658, a difference of 0.10%). Similarly, the demographic groups most similar to Vietnamese are Immigrants from Iraq ($52,681, a difference of 0.30%), Immigrants from Colombia ($52,725, a difference of 0.38%), Ghanaian ($52,810, a difference of 0.54%), Panamanian ($52,835, a difference of 0.59%), and Immigrants from Uruguay ($52,860, a difference of 0.64%).
| Demographics | Rating | Rank | Median Male Earnings |
| Immigrants | Eritrea | 31.8 /100 | #187 | Fair $53,715 |
| Immigrants | Eastern Africa | 31.8 /100 | #188 | Fair $53,713 |
| Puget Sound Salish | 31.6 /100 | #189 | Fair $53,704 |
| Uruguayans | 31.1 /100 | #190 | Fair $53,680 |
| Guamanians/Chamorros | 30.7 /100 | #191 | Fair $53,661 |
| Scotch-Irish | 30.6 /100 | #192 | Fair $53,658 |
| Kenyans | 30.4 /100 | #193 | Fair $53,647 |
| Spanish | 29.0 /100 | #194 | Fair $53,576 |
| Immigrants | Azores | 27.5 /100 | #195 | Fair $53,503 |
| Immigrants | Africa | 26.6 /100 | #196 | Fair $53,457 |
| Immigrants | Kenya | 26.0 /100 | #197 | Fair $53,427 |
| Immigrants | Costa Rica | 22.6 /100 | #198 | Fair $53,237 |
| Tongans | 22.3 /100 | #199 | Fair $53,218 |
| Immigrants | Thailand | 17.5 /100 | #200 | Poor $52,908 |
| Immigrants | Bosnia and Herzegovina | 16.9 /100 | #201 | Poor $52,869 |
| Immigrants | Uruguay | 16.8 /100 | #202 | Poor $52,860 |
| Panamanians | 16.5 /100 | #203 | Poor $52,835 |
| Ghanaians | 16.1 /100 | #204 | Poor $52,810 |
| Immigrants | Colombia | 15.0 /100 | #205 | Poor $52,725 |
| Immigrants | Iraq | 14.5 /100 | #206 | Poor $52,681 |
| Vietnamese | 12.7 /100 | #207 | Poor $52,525 |