Immigrants from Cameroon vs Immigrants from Southern Europe Householder Income Under 25 years
COMPARE
Immigrants from Cameroon
Immigrants from Southern Europe
Householder Income Under 25 years
Householder Income Under 25 years Comparison
Immigrants from Cameroon
Immigrants from Southern Europe
$51,433
HOUSEHOLDER INCOME UNDER 25 YEARS
13.6/ 100
METRIC RATING
203rd/ 347
METRIC RANK
$54,484
HOUSEHOLDER INCOME UNDER 25 YEARS
99.6/ 100
METRIC RATING
77th/ 347
METRIC RANK
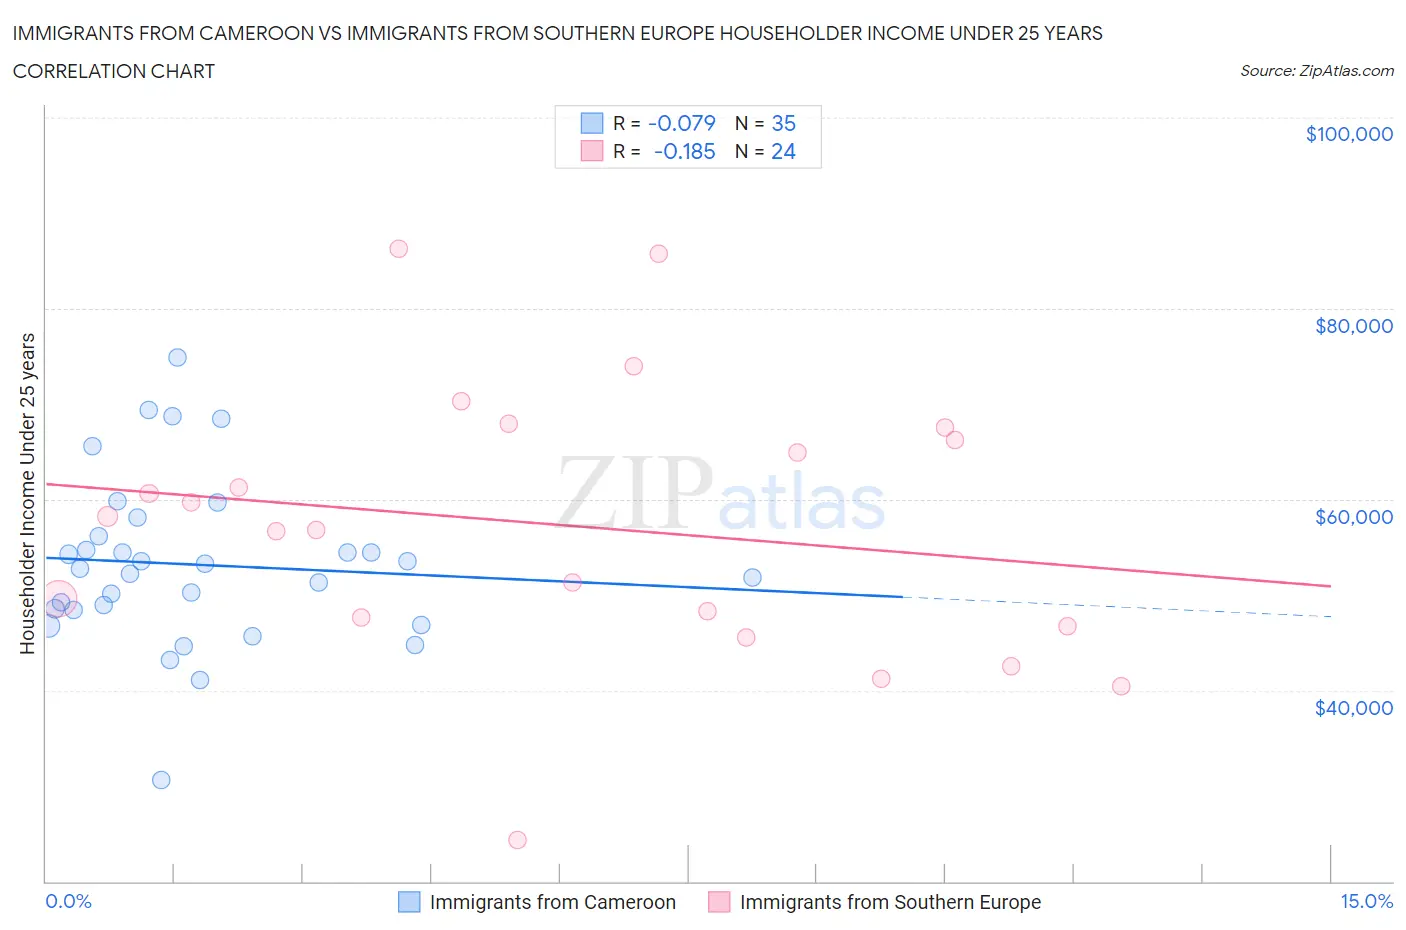
Immigrants from Cameroon vs Immigrants from Southern Europe Householder Income Under 25 years Correlation Chart
The statistical analysis conducted on geographies consisting of 122,005,064 people shows a slight negative correlation between the proportion of Immigrants from Cameroon and household income with householder under the age of 25 in the United States with a correlation coefficient (R) of -0.079 and weighted average of $51,433. Similarly, the statistical analysis conducted on geographies consisting of 332,779,485 people shows a poor negative correlation between the proportion of Immigrants from Southern Europe and household income with householder under the age of 25 in the United States with a correlation coefficient (R) of -0.185 and weighted average of $54,484, a difference of 5.9%.
Householder Income Under 25 years Correlation Summary
| Measurement | Immigrants from Cameroon | Immigrants from Southern Europe |
| Minimum | $30,616 | $24,293 |
| Maximum | $74,921 | $86,315 |
| Range | $44,305 | $62,022 |
| Mean | $53,155 | $57,230 |
| Median | $52,684 | $57,501 |
| Interquartile 25% (IQ1) | $48,466 | $47,158 |
| Interquartile 75% (IQ3) | $56,097 | $66,842 |
| Interquartile Range (IQR) | $7,631 | $19,684 |
| Standard Deviation (Sample) | $8,793 | $14,522 |
| Standard Deviation (Population) | $8,666 | $14,216 |
Similar Demographics by Householder Income Under 25 years
Demographics Similar to Immigrants from Cameroon by Householder Income Under 25 years
In terms of householder income under 25 years, the demographic groups most similar to Immigrants from Cameroon are Czech ($51,421, a difference of 0.020%), Immigrants from Guatemala ($51,447, a difference of 0.030%), Immigrants from West Indies ($51,479, a difference of 0.090%), British ($51,477, a difference of 0.090%), and Cape Verdean ($51,387, a difference of 0.090%).
| Demographics | Rating | Rank | Householder Income Under 25 years |
| Palestinians | 16.1 /100 | #196 | Poor $51,515 |
| Pima | 15.7 /100 | #197 | Poor $51,503 |
| Immigrants | Syria | 15.4 /100 | #198 | Poor $51,494 |
| Swiss | 15.4 /100 | #199 | Poor $51,493 |
| Immigrants | West Indies | 14.9 /100 | #200 | Poor $51,479 |
| British | 14.9 /100 | #201 | Poor $51,477 |
| Immigrants | Guatemala | 14.0 /100 | #202 | Poor $51,447 |
| Immigrants | Cameroon | 13.6 /100 | #203 | Poor $51,433 |
| Czechs | 13.2 /100 | #204 | Poor $51,421 |
| Cape Verdeans | 12.3 /100 | #205 | Poor $51,387 |
| Immigrants | Latin America | 12.3 /100 | #206 | Poor $51,387 |
| South Africans | 12.2 /100 | #207 | Poor $51,383 |
| Immigrants | Jordan | 11.9 /100 | #208 | Poor $51,370 |
| Syrians | 11.4 /100 | #209 | Poor $51,353 |
| Immigrants | Ghana | 10.9 /100 | #210 | Poor $51,333 |
Demographics Similar to Immigrants from Southern Europe by Householder Income Under 25 years
In terms of householder income under 25 years, the demographic groups most similar to Immigrants from Southern Europe are Immigrants from Brazil ($54,487, a difference of 0.010%), Nepalese ($54,472, a difference of 0.020%), Immigrants from Sri Lanka ($54,512, a difference of 0.050%), Immigrants from Italy ($54,449, a difference of 0.060%), and Egyptian ($54,444, a difference of 0.070%).
| Demographics | Rating | Rank | Householder Income Under 25 years |
| Immigrants | El Salvador | 99.7 /100 | #70 | Exceptional $54,599 |
| Immigrants | Morocco | 99.7 /100 | #71 | Exceptional $54,593 |
| Immigrants | Northern Europe | 99.7 /100 | #72 | Exceptional $54,571 |
| Macedonians | 99.7 /100 | #73 | Exceptional $54,563 |
| Immigrants | Grenada | 99.7 /100 | #74 | Exceptional $54,538 |
| Immigrants | Sri Lanka | 99.7 /100 | #75 | Exceptional $54,512 |
| Immigrants | Brazil | 99.6 /100 | #76 | Exceptional $54,487 |
| Immigrants | Southern Europe | 99.6 /100 | #77 | Exceptional $54,484 |
| Nepalese | 99.6 /100 | #78 | Exceptional $54,472 |
| Immigrants | Italy | 99.6 /100 | #79 | Exceptional $54,449 |
| Egyptians | 99.6 /100 | #80 | Exceptional $54,444 |
| Portuguese | 99.6 /100 | #81 | Exceptional $54,436 |
| Russians | 99.5 /100 | #82 | Exceptional $54,389 |
| Laotians | 99.5 /100 | #83 | Exceptional $54,369 |
| Bulgarians | 99.5 /100 | #84 | Exceptional $54,352 |