Immigrants from Armenia vs Immigrants from Southern Europe Householder Income Under 25 years
COMPARE
Immigrants from Armenia
Immigrants from Southern Europe
Householder Income Under 25 years
Householder Income Under 25 years Comparison
Immigrants from Armenia
Immigrants from Southern Europe
$52,986
HOUSEHOLDER INCOME UNDER 25 YEARS
87.5/ 100
METRIC RATING
142nd/ 347
METRIC RANK
$54,484
HOUSEHOLDER INCOME UNDER 25 YEARS
99.6/ 100
METRIC RATING
77th/ 347
METRIC RANK
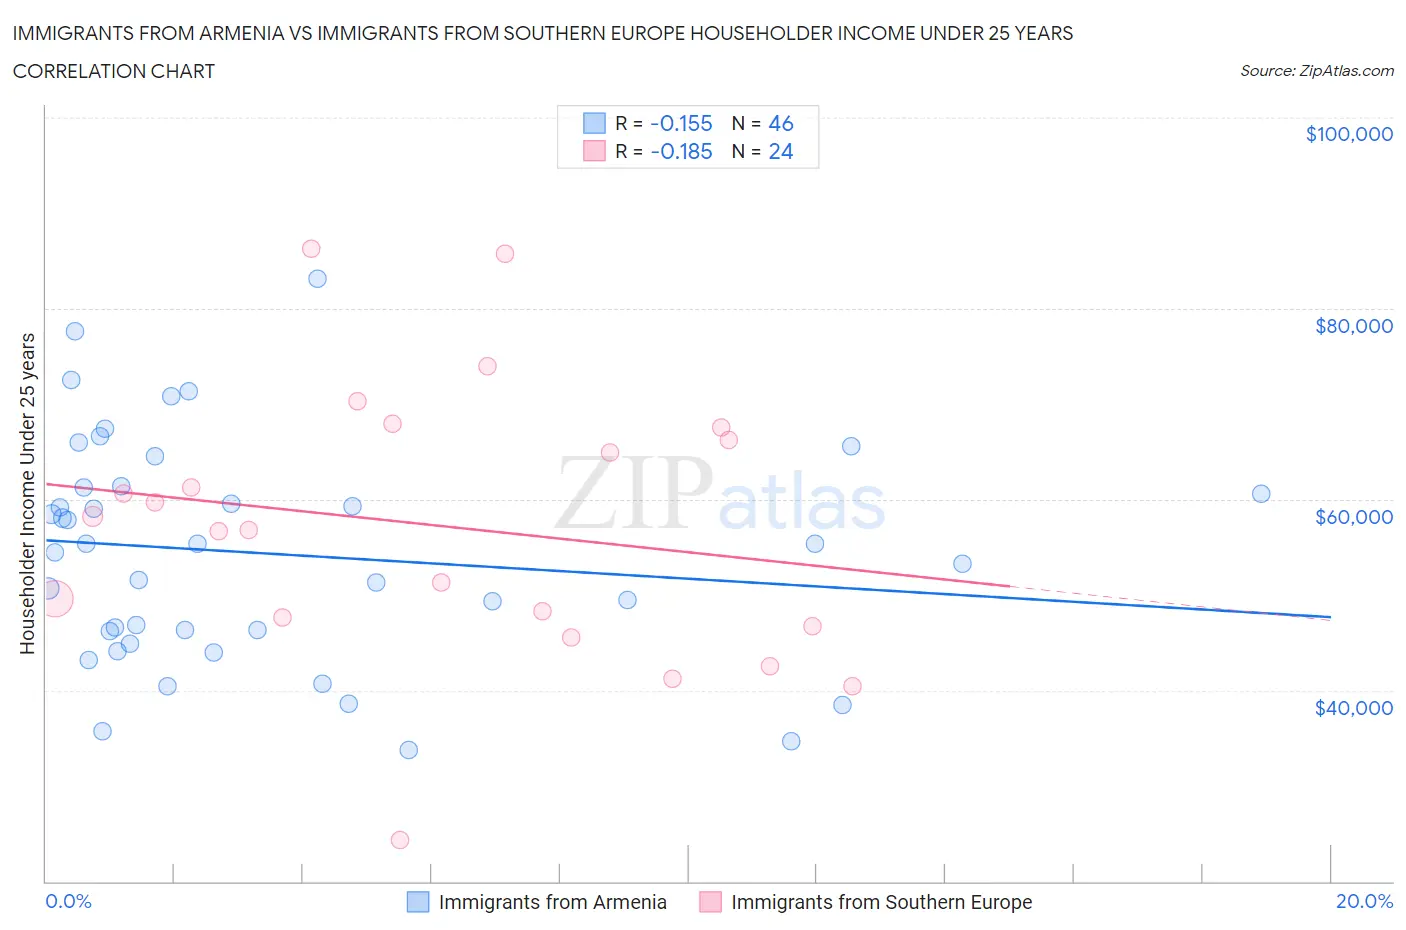
Immigrants from Armenia vs Immigrants from Southern Europe Householder Income Under 25 years Correlation Chart
The statistical analysis conducted on geographies consisting of 89,815,578 people shows a poor negative correlation between the proportion of Immigrants from Armenia and household income with householder under the age of 25 in the United States with a correlation coefficient (R) of -0.155 and weighted average of $52,986. Similarly, the statistical analysis conducted on geographies consisting of 332,779,485 people shows a poor negative correlation between the proportion of Immigrants from Southern Europe and household income with householder under the age of 25 in the United States with a correlation coefficient (R) of -0.185 and weighted average of $54,484, a difference of 2.8%.
Householder Income Under 25 years Correlation Summary
| Measurement | Immigrants from Armenia | Immigrants from Southern Europe |
| Minimum | $33,721 | $24,293 |
| Maximum | $83,068 | $86,315 |
| Range | $49,347 | $62,022 |
| Mean | $54,283 | $57,230 |
| Median | $54,908 | $57,501 |
| Interquartile 25% (IQ1) | $46,216 | $47,158 |
| Interquartile 75% (IQ3) | $61,264 | $66,842 |
| Interquartile Range (IQR) | $15,048 | $19,684 |
| Standard Deviation (Sample) | $11,620 | $14,522 |
| Standard Deviation (Population) | $11,493 | $14,216 |
Similar Demographics by Householder Income Under 25 years
Demographics Similar to Immigrants from Armenia by Householder Income Under 25 years
In terms of householder income under 25 years, the demographic groups most similar to Immigrants from Armenia are Swedish ($52,986, a difference of 0.0%), South American Indian ($52,979, a difference of 0.010%), Immigrants from Western Europe ($52,957, a difference of 0.050%), Danish ($53,041, a difference of 0.10%), and Hawaiian ($53,078, a difference of 0.17%).
| Demographics | Rating | Rank | Householder Income Under 25 years |
| Chileans | 91.9 /100 | #135 | Exceptional $53,185 |
| Armenians | 91.8 /100 | #136 | Exceptional $53,179 |
| Immigrants | Barbados | 91.5 /100 | #137 | Exceptional $53,163 |
| Norwegians | 90.8 /100 | #138 | Exceptional $53,127 |
| Costa Ricans | 90.4 /100 | #139 | Exceptional $53,106 |
| Hawaiians | 89.8 /100 | #140 | Excellent $53,078 |
| Danes | 88.9 /100 | #141 | Excellent $53,041 |
| Immigrants | Armenia | 87.5 /100 | #142 | Excellent $52,986 |
| Swedes | 87.5 /100 | #143 | Excellent $52,986 |
| South American Indians | 87.3 /100 | #144 | Excellent $52,979 |
| Immigrants | Western Europe | 86.7 /100 | #145 | Excellent $52,957 |
| Immigrants | Hungary | 81.6 /100 | #146 | Excellent $52,798 |
| Latvians | 81.0 /100 | #147 | Excellent $52,783 |
| French Canadians | 76.5 /100 | #148 | Good $52,672 |
| Scandinavians | 75.7 /100 | #149 | Good $52,654 |
Demographics Similar to Immigrants from Southern Europe by Householder Income Under 25 years
In terms of householder income under 25 years, the demographic groups most similar to Immigrants from Southern Europe are Immigrants from Brazil ($54,487, a difference of 0.010%), Nepalese ($54,472, a difference of 0.020%), Immigrants from Sri Lanka ($54,512, a difference of 0.050%), Immigrants from Italy ($54,449, a difference of 0.060%), and Egyptian ($54,444, a difference of 0.070%).
| Demographics | Rating | Rank | Householder Income Under 25 years |
| Immigrants | El Salvador | 99.7 /100 | #70 | Exceptional $54,599 |
| Immigrants | Morocco | 99.7 /100 | #71 | Exceptional $54,593 |
| Immigrants | Northern Europe | 99.7 /100 | #72 | Exceptional $54,571 |
| Macedonians | 99.7 /100 | #73 | Exceptional $54,563 |
| Immigrants | Grenada | 99.7 /100 | #74 | Exceptional $54,538 |
| Immigrants | Sri Lanka | 99.7 /100 | #75 | Exceptional $54,512 |
| Immigrants | Brazil | 99.6 /100 | #76 | Exceptional $54,487 |
| Immigrants | Southern Europe | 99.6 /100 | #77 | Exceptional $54,484 |
| Nepalese | 99.6 /100 | #78 | Exceptional $54,472 |
| Immigrants | Italy | 99.6 /100 | #79 | Exceptional $54,449 |
| Egyptians | 99.6 /100 | #80 | Exceptional $54,444 |
| Portuguese | 99.6 /100 | #81 | Exceptional $54,436 |
| Russians | 99.5 /100 | #82 | Exceptional $54,389 |
| Laotians | 99.5 /100 | #83 | Exceptional $54,369 |
| Bulgarians | 99.5 /100 | #84 | Exceptional $54,352 |