Immigrants from Bosnia and Herzegovina vs Vietnamese Median Family Income
COMPARE
Immigrants from Bosnia and Herzegovina
Vietnamese
Median Family Income
Median Family Income Comparison
Immigrants from Bosnia and Herzegovina
Vietnamese
$97,432
MEDIAN FAMILY INCOME
6.4/ 100
METRIC RATING
216th/ 347
METRIC RANK
$96,123
MEDIAN FAMILY INCOME
3.4/ 100
METRIC RATING
225th/ 347
METRIC RANK
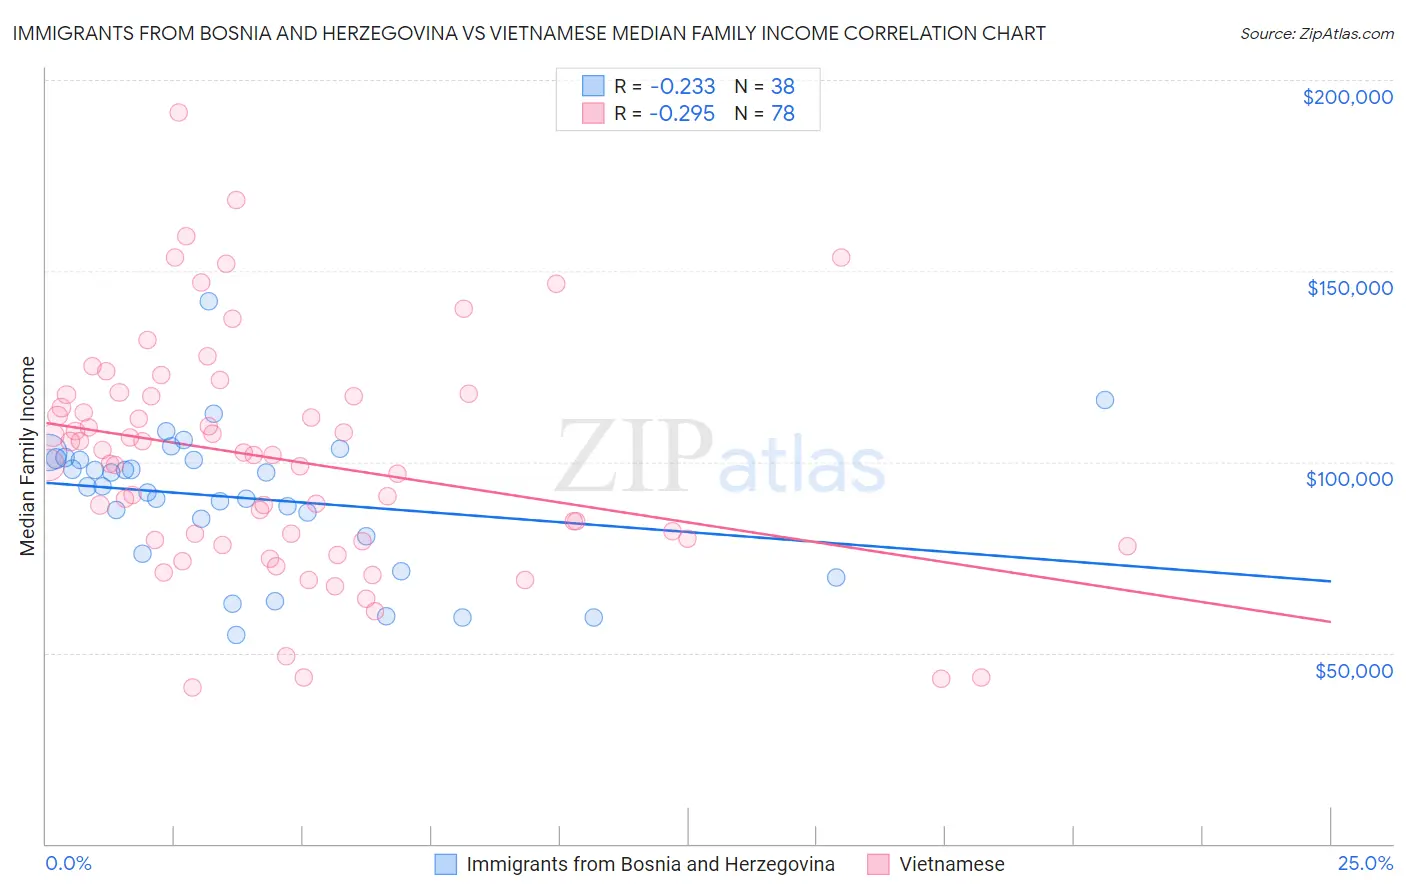
Immigrants from Bosnia and Herzegovina vs Vietnamese Median Family Income Correlation Chart
The statistical analysis conducted on geographies consisting of 156,800,946 people shows a weak negative correlation between the proportion of Immigrants from Bosnia and Herzegovina and median family income in the United States with a correlation coefficient (R) of -0.233 and weighted average of $97,432. Similarly, the statistical analysis conducted on geographies consisting of 170,610,316 people shows a weak negative correlation between the proportion of Vietnamese and median family income in the United States with a correlation coefficient (R) of -0.295 and weighted average of $96,123, a difference of 1.4%.
Median Family Income Correlation Summary
| Measurement | Immigrants from Bosnia and Herzegovina | Vietnamese |
| Minimum | $54,501 | $40,807 |
| Maximum | $142,183 | $191,643 |
| Range | $87,682 | $150,837 |
| Mean | $90,450 | $100,636 |
| Median | $93,519 | $101,824 |
| Interquartile 25% (IQ1) | $80,405 | $79,608 |
| Interquartile 75% (IQ3) | $100,969 | $117,250 |
| Interquartile Range (IQR) | $20,564 | $37,642 |
| Standard Deviation (Sample) | $18,350 | $30,077 |
| Standard Deviation (Population) | $18,107 | $29,884 |
Demographics Similar to Immigrants from Bosnia and Herzegovina and Vietnamese by Median Family Income
In terms of median family income, the demographic groups most similar to Immigrants from Bosnia and Herzegovina are Nigerian ($97,522, a difference of 0.090%), Bermudan ($97,577, a difference of 0.15%), Japanese ($97,288, a difference of 0.15%), Immigrants from Armenia ($97,605, a difference of 0.18%), and Immigrants from Cambodia ($97,222, a difference of 0.22%). Similarly, the demographic groups most similar to Vietnamese are Nonimmigrants ($96,231, a difference of 0.11%), Venezuelan ($96,281, a difference of 0.16%), Immigrants from Nigeria ($96,439, a difference of 0.33%), Immigrants from Ghana ($96,544, a difference of 0.44%), and Immigrants from Panama ($95,647, a difference of 0.50%).
| Demographics | Rating | Rank | Median Family Income |
| Puget Sound Salish | 8.2 /100 | #210 | Tragic $97,958 |
| Immigrants | Sudan | 7.4 /100 | #211 | Tragic $97,737 |
| Panamanians | 7.2 /100 | #212 | Tragic $97,683 |
| Immigrants | Armenia | 7.0 /100 | #213 | Tragic $97,605 |
| Bermudans | 6.9 /100 | #214 | Tragic $97,577 |
| Nigerians | 6.7 /100 | #215 | Tragic $97,522 |
| Immigrants | Bosnia and Herzegovina | 6.4 /100 | #216 | Tragic $97,432 |
| Japanese | 6.0 /100 | #217 | Tragic $97,288 |
| Immigrants | Cambodia | 5.8 /100 | #218 | Tragic $97,222 |
| Delaware | 5.1 /100 | #219 | Tragic $96,958 |
| Sudanese | 4.7 /100 | #220 | Tragic $96,783 |
| Immigrants | Ghana | 4.2 /100 | #221 | Tragic $96,544 |
| Immigrants | Nigeria | 4.0 /100 | #222 | Tragic $96,439 |
| Venezuelans | 3.7 /100 | #223 | Tragic $96,281 |
| Immigrants | Nonimmigrants | 3.6 /100 | #224 | Tragic $96,231 |
| Vietnamese | 3.4 /100 | #225 | Tragic $96,123 |
| Immigrants | Panama | 2.7 /100 | #226 | Tragic $95,647 |
| Alaska Natives | 2.6 /100 | #227 | Tragic $95,573 |
| Immigrants | Azores | 2.4 /100 | #228 | Tragic $95,402 |
| Marshallese | 2.2 /100 | #229 | Tragic $95,293 |
| Malaysians | 2.2 /100 | #230 | Tragic $95,230 |