Immigrants from Bosnia and Herzegovina vs Immigrants from Western Africa Median Family Income
COMPARE
Immigrants from Bosnia and Herzegovina
Immigrants from Western Africa
Median Family Income
Median Family Income Comparison
Immigrants from Bosnia and Herzegovina
Immigrants from Western Africa
$97,432
MEDIAN FAMILY INCOME
6.4/ 100
METRIC RATING
216th/ 347
METRIC RANK
$94,638
MEDIAN FAMILY INCOME
1.6/ 100
METRIC RATING
234th/ 347
METRIC RANK
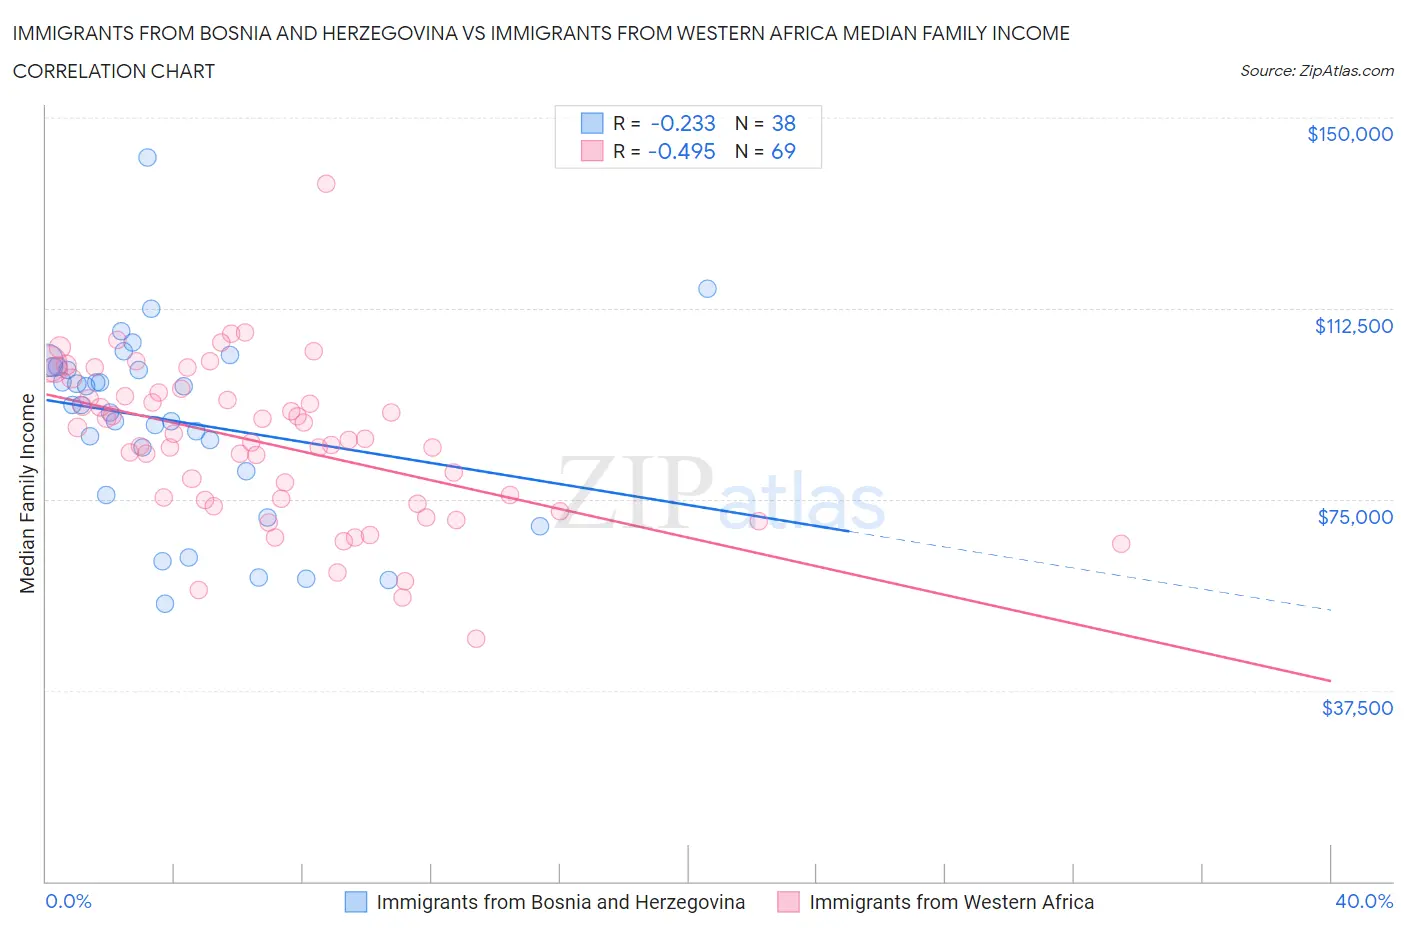
Immigrants from Bosnia and Herzegovina vs Immigrants from Western Africa Median Family Income Correlation Chart
The statistical analysis conducted on geographies consisting of 156,800,946 people shows a weak negative correlation between the proportion of Immigrants from Bosnia and Herzegovina and median family income in the United States with a correlation coefficient (R) of -0.233 and weighted average of $97,432. Similarly, the statistical analysis conducted on geographies consisting of 357,410,586 people shows a moderate negative correlation between the proportion of Immigrants from Western Africa and median family income in the United States with a correlation coefficient (R) of -0.495 and weighted average of $94,638, a difference of 2.9%.
Median Family Income Correlation Summary
| Measurement | Immigrants from Bosnia and Herzegovina | Immigrants from Western Africa |
| Minimum | $54,501 | $47,599 |
| Maximum | $142,183 | $136,923 |
| Range | $87,682 | $89,324 |
| Mean | $90,450 | $85,944 |
| Median | $93,519 | $86,589 |
| Interquartile 25% (IQ1) | $80,405 | $74,581 |
| Interquartile 75% (IQ3) | $100,969 | $95,623 |
| Interquartile Range (IQR) | $20,564 | $21,043 |
| Standard Deviation (Sample) | $18,350 | $15,373 |
| Standard Deviation (Population) | $18,107 | $15,261 |
Demographics Similar to Immigrants from Bosnia and Herzegovina and Immigrants from Western Africa by Median Family Income
In terms of median family income, the demographic groups most similar to Immigrants from Bosnia and Herzegovina are Nigerian ($97,522, a difference of 0.090%), Japanese ($97,288, a difference of 0.15%), Immigrants from Cambodia ($97,222, a difference of 0.22%), Delaware ($96,958, a difference of 0.49%), and Sudanese ($96,783, a difference of 0.67%). Similarly, the demographic groups most similar to Immigrants from Western Africa are Immigrants from Bangladesh ($94,665, a difference of 0.030%), Immigrants from Burma/Myanmar ($94,472, a difference of 0.18%), Immigrants from Venezuela ($94,904, a difference of 0.28%), Ecuadorian ($95,114, a difference of 0.50%), and Malaysian ($95,230, a difference of 0.63%).
| Demographics | Rating | Rank | Median Family Income |
| Nigerians | 6.7 /100 | #215 | Tragic $97,522 |
| Immigrants | Bosnia and Herzegovina | 6.4 /100 | #216 | Tragic $97,432 |
| Japanese | 6.0 /100 | #217 | Tragic $97,288 |
| Immigrants | Cambodia | 5.8 /100 | #218 | Tragic $97,222 |
| Delaware | 5.1 /100 | #219 | Tragic $96,958 |
| Sudanese | 4.7 /100 | #220 | Tragic $96,783 |
| Immigrants | Ghana | 4.2 /100 | #221 | Tragic $96,544 |
| Immigrants | Nigeria | 4.0 /100 | #222 | Tragic $96,439 |
| Venezuelans | 3.7 /100 | #223 | Tragic $96,281 |
| Immigrants | Nonimmigrants | 3.6 /100 | #224 | Tragic $96,231 |
| Vietnamese | 3.4 /100 | #225 | Tragic $96,123 |
| Immigrants | Panama | 2.7 /100 | #226 | Tragic $95,647 |
| Alaska Natives | 2.6 /100 | #227 | Tragic $95,573 |
| Immigrants | Azores | 2.4 /100 | #228 | Tragic $95,402 |
| Marshallese | 2.2 /100 | #229 | Tragic $95,293 |
| Malaysians | 2.2 /100 | #230 | Tragic $95,230 |
| Ecuadorians | 2.1 /100 | #231 | Tragic $95,114 |
| Immigrants | Venezuela | 1.9 /100 | #232 | Tragic $94,904 |
| Immigrants | Bangladesh | 1.6 /100 | #233 | Tragic $94,665 |
| Immigrants | Western Africa | 1.6 /100 | #234 | Tragic $94,638 |
| Immigrants | Burma/Myanmar | 1.5 /100 | #235 | Tragic $94,472 |