Immigrants from Australia vs Albanian Median Male Earnings
COMPARE
Immigrants from Australia
Albanian
Median Male Earnings
Median Male Earnings Comparison
Immigrants from Australia
Albanians
$67,634
MEDIAN MALE EARNINGS
100.0/ 100
METRIC RATING
12th/ 347
METRIC RANK
$58,680
MEDIAN MALE EARNINGS
98.4/ 100
METRIC RATING
96th/ 347
METRIC RANK
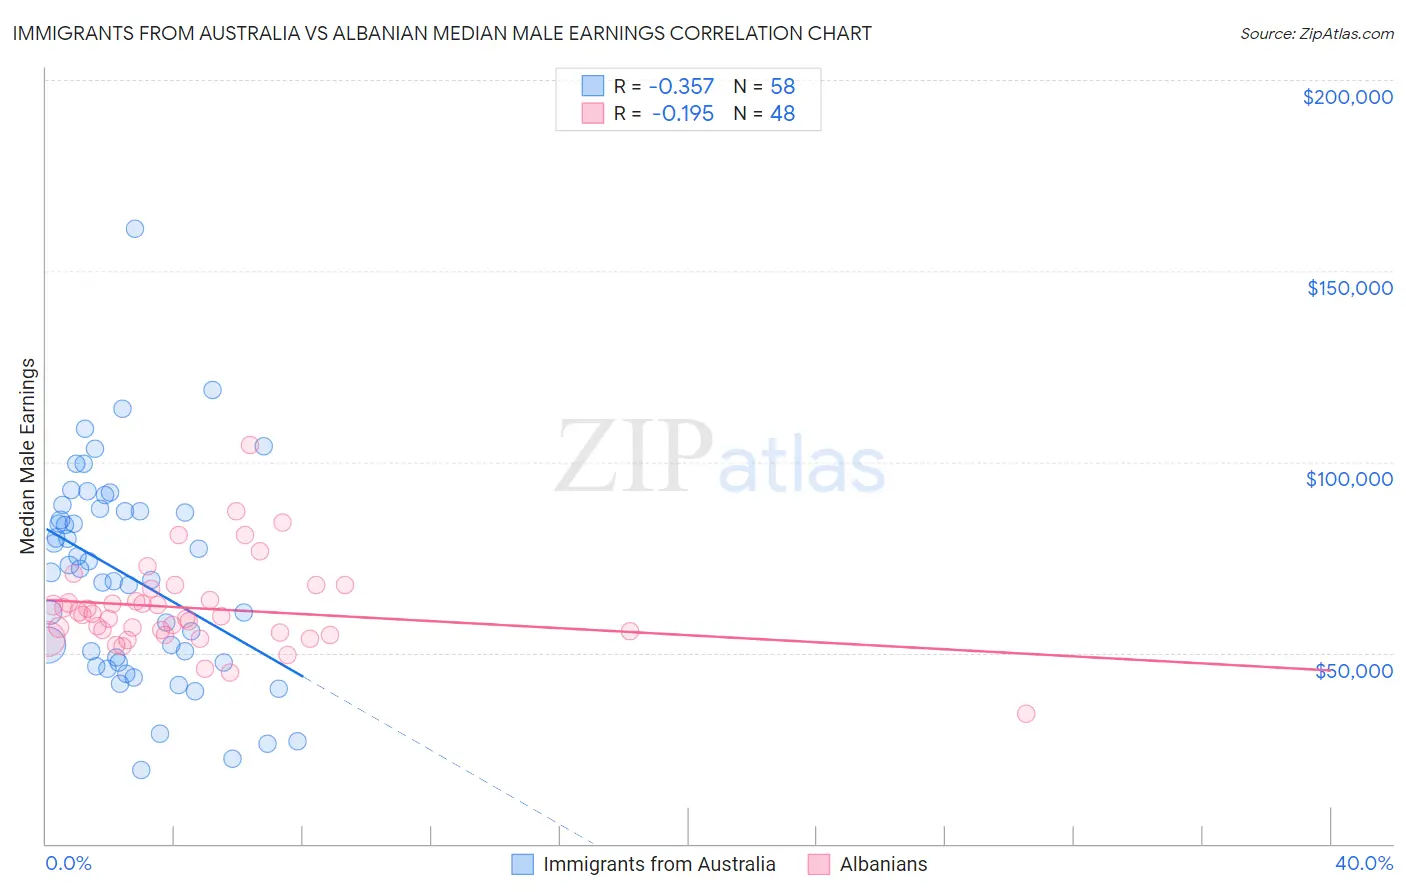
Immigrants from Australia vs Albanian Median Male Earnings Correlation Chart
The statistical analysis conducted on geographies consisting of 227,162,363 people shows a mild negative correlation between the proportion of Immigrants from Australia and median male earnings in the United States with a correlation coefficient (R) of -0.357 and weighted average of $67,634. Similarly, the statistical analysis conducted on geographies consisting of 193,234,421 people shows a poor negative correlation between the proportion of Albanians and median male earnings in the United States with a correlation coefficient (R) of -0.195 and weighted average of $58,680, a difference of 15.3%.
Median Male Earnings Correlation Summary
| Measurement | Immigrants from Australia | Albanian |
| Minimum | $19,341 | $34,079 |
| Maximum | $160,989 | $104,479 |
| Range | $141,648 | $70,400 |
| Mean | $69,957 | $61,666 |
| Median | $71,553 | $59,610 |
| Interquartile 25% (IQ1) | $47,501 | $54,972 |
| Interquartile 75% (IQ3) | $87,155 | $65,262 |
| Interquartile Range (IQR) | $39,654 | $10,290 |
| Standard Deviation (Sample) | $27,266 | $11,807 |
| Standard Deviation (Population) | $27,029 | $11,684 |
Similar Demographics by Median Male Earnings
Demographics Similar to Immigrants from Australia by Median Male Earnings
In terms of median male earnings, the demographic groups most similar to Immigrants from Australia are Immigrants from Ireland ($67,698, a difference of 0.090%), Immigrants from China ($67,353, a difference of 0.42%), Okinawan ($67,232, a difference of 0.60%), Immigrants from Eastern Asia ($66,903, a difference of 1.1%), and Immigrants from Israel ($68,716, a difference of 1.6%).
| Demographics | Rating | Rank | Median Male Earnings |
| Immigrants | Singapore | 100.0 /100 | #5 | Exceptional $71,348 |
| Iranians | 100.0 /100 | #6 | Exceptional $70,648 |
| Immigrants | Hong Kong | 100.0 /100 | #7 | Exceptional $70,146 |
| Immigrants | Iran | 100.0 /100 | #8 | Exceptional $69,284 |
| Immigrants | South Central Asia | 100.0 /100 | #9 | Exceptional $68,960 |
| Immigrants | Israel | 100.0 /100 | #10 | Exceptional $68,716 |
| Immigrants | Ireland | 100.0 /100 | #11 | Exceptional $67,698 |
| Immigrants | Australia | 100.0 /100 | #12 | Exceptional $67,634 |
| Immigrants | China | 100.0 /100 | #13 | Exceptional $67,353 |
| Okinawans | 100.0 /100 | #14 | Exceptional $67,232 |
| Immigrants | Eastern Asia | 100.0 /100 | #15 | Exceptional $66,903 |
| Eastern Europeans | 100.0 /100 | #16 | Exceptional $66,472 |
| Immigrants | Belgium | 100.0 /100 | #17 | Exceptional $66,125 |
| Indians (Asian) | 100.0 /100 | #18 | Exceptional $66,078 |
| Cypriots | 100.0 /100 | #19 | Exceptional $65,549 |
Demographics Similar to Albanians by Median Male Earnings
In terms of median male earnings, the demographic groups most similar to Albanians are Northern European ($58,588, a difference of 0.16%), Immigrants from Lebanon ($58,835, a difference of 0.27%), Jordanian ($58,500, a difference of 0.31%), Immigrants from Poland ($58,452, a difference of 0.39%), and Assyrian/Chaldean/Syriac ($58,437, a difference of 0.42%).
| Demographics | Rating | Rank | Median Male Earnings |
| Immigrants | Moldova | 99.2 /100 | #89 | Exceptional $59,417 |
| Austrians | 99.2 /100 | #90 | Exceptional $59,359 |
| Laotians | 99.2 /100 | #91 | Exceptional $59,351 |
| Immigrants | Kazakhstan | 99.1 /100 | #92 | Exceptional $59,278 |
| Immigrants | Southern Europe | 99.0 /100 | #93 | Exceptional $59,217 |
| Immigrants | North Macedonia | 99.0 /100 | #94 | Exceptional $59,189 |
| Immigrants | Lebanon | 98.6 /100 | #95 | Exceptional $58,835 |
| Albanians | 98.4 /100 | #96 | Exceptional $58,680 |
| Northern Europeans | 98.2 /100 | #97 | Exceptional $58,588 |
| Jordanians | 98.1 /100 | #98 | Exceptional $58,500 |
| Immigrants | Poland | 98.0 /100 | #99 | Exceptional $58,452 |
| Assyrians/Chaldeans/Syriacs | 97.9 /100 | #100 | Exceptional $58,437 |
| Immigrants | Brazil | 97.7 /100 | #101 | Exceptional $58,324 |
| Syrians | 97.4 /100 | #102 | Exceptional $58,187 |
| Poles | 97.3 /100 | #103 | Exceptional $58,139 |