Immigrants from Argentina vs Crow Median Male Earnings
COMPARE
Immigrants from Argentina
Crow
Median Male Earnings
Median Male Earnings Comparison
Immigrants from Argentina
Crow
$59,491
MEDIAN MALE EARNINGS
99.3/ 100
METRIC RATING
88th/ 347
METRIC RANK
$42,434
MEDIAN MALE EARNINGS
0.0/ 100
METRIC RATING
338th/ 347
METRIC RANK
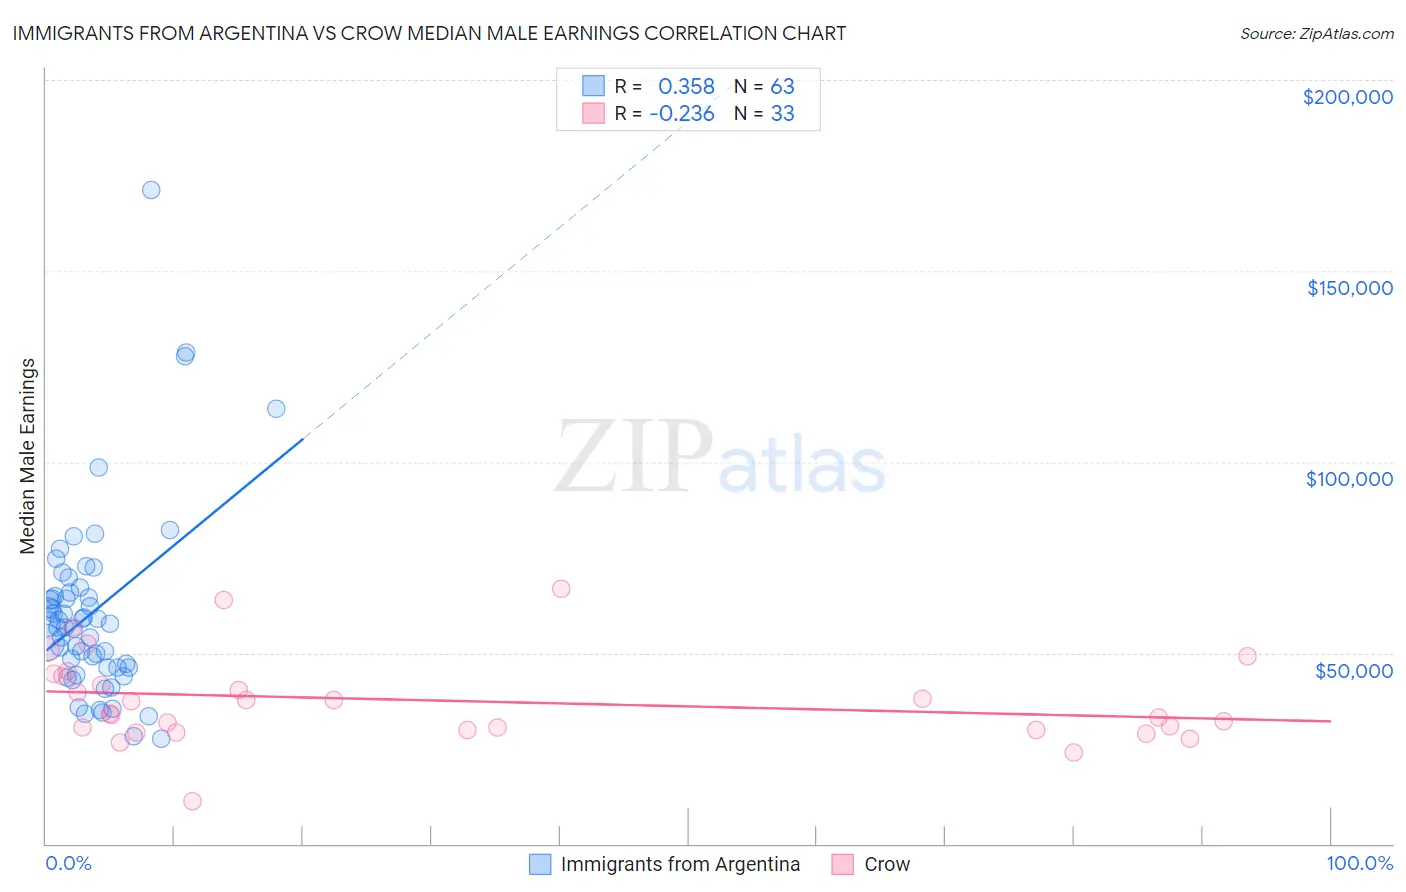
Immigrants from Argentina vs Crow Median Male Earnings Correlation Chart
The statistical analysis conducted on geographies consisting of 264,393,462 people shows a mild positive correlation between the proportion of Immigrants from Argentina and median male earnings in the United States with a correlation coefficient (R) of 0.358 and weighted average of $59,491. Similarly, the statistical analysis conducted on geographies consisting of 59,199,884 people shows a weak negative correlation between the proportion of Crow and median male earnings in the United States with a correlation coefficient (R) of -0.236 and weighted average of $42,434, a difference of 40.2%.
Median Male Earnings Correlation Summary
| Measurement | Immigrants from Argentina | Crow |
| Minimum | $27,639 | $11,094 |
| Maximum | $171,304 | $66,875 |
| Range | $143,665 | $55,781 |
| Mean | $60,629 | $37,474 |
| Median | $57,556 | $33,966 |
| Interquartile 25% (IQ1) | $46,111 | $29,676 |
| Interquartile 75% (IQ3) | $65,873 | $44,202 |
| Interquartile Range (IQR) | $19,762 | $14,526 |
| Standard Deviation (Sample) | $24,754 | $11,614 |
| Standard Deviation (Population) | $24,557 | $11,436 |
Similar Demographics by Median Male Earnings
Demographics Similar to Immigrants from Argentina by Median Male Earnings
In terms of median male earnings, the demographic groups most similar to Immigrants from Argentina are Macedonian ($59,522, a difference of 0.050%), Immigrants from England ($59,527, a difference of 0.060%), Italian ($59,551, a difference of 0.10%), Afghan ($59,554, a difference of 0.11%), and Immigrants from Moldova ($59,417, a difference of 0.12%).
| Demographics | Rating | Rank | Median Male Earnings |
| Ukrainians | 99.4 /100 | #81 | Exceptional $59,728 |
| Croatians | 99.4 /100 | #82 | Exceptional $59,715 |
| Immigrants | Italy | 99.4 /100 | #83 | Exceptional $59,691 |
| Afghans | 99.3 /100 | #84 | Exceptional $59,554 |
| Italians | 99.3 /100 | #85 | Exceptional $59,551 |
| Immigrants | England | 99.3 /100 | #86 | Exceptional $59,527 |
| Macedonians | 99.3 /100 | #87 | Exceptional $59,522 |
| Immigrants | Argentina | 99.3 /100 | #88 | Exceptional $59,491 |
| Immigrants | Moldova | 99.2 /100 | #89 | Exceptional $59,417 |
| Austrians | 99.2 /100 | #90 | Exceptional $59,359 |
| Laotians | 99.2 /100 | #91 | Exceptional $59,351 |
| Immigrants | Kazakhstan | 99.1 /100 | #92 | Exceptional $59,278 |
| Immigrants | Southern Europe | 99.0 /100 | #93 | Exceptional $59,217 |
| Immigrants | North Macedonia | 99.0 /100 | #94 | Exceptional $59,189 |
| Immigrants | Lebanon | 98.6 /100 | #95 | Exceptional $58,835 |
Demographics Similar to Crow by Median Male Earnings
In terms of median male earnings, the demographic groups most similar to Crow are Pima ($42,357, a difference of 0.18%), Menominee ($42,581, a difference of 0.35%), Navajo ($42,098, a difference of 0.80%), Hopi ($42,060, a difference of 0.89%), and Arapaho ($41,758, a difference of 1.6%).
| Demographics | Rating | Rank | Median Male Earnings |
| Natives/Alaskans | 0.0 /100 | #331 | Tragic $44,775 |
| Bahamians | 0.0 /100 | #332 | Tragic $44,756 |
| Immigrants | Congo | 0.0 /100 | #333 | Tragic $44,204 |
| Immigrants | Yemen | 0.0 /100 | #334 | Tragic $44,083 |
| Spanish American Indians | 0.0 /100 | #335 | Tragic $44,010 |
| Immigrants | Cuba | 0.0 /100 | #336 | Tragic $43,461 |
| Menominee | 0.0 /100 | #337 | Tragic $42,581 |
| Crow | 0.0 /100 | #338 | Tragic $42,434 |
| Pima | 0.0 /100 | #339 | Tragic $42,357 |
| Navajo | 0.0 /100 | #340 | Tragic $42,098 |
| Hopi | 0.0 /100 | #341 | Tragic $42,060 |
| Arapaho | 0.0 /100 | #342 | Tragic $41,758 |
| Lumbee | 0.0 /100 | #343 | Tragic $41,715 |
| Pueblo | 0.0 /100 | #344 | Tragic $41,314 |
| Puerto Ricans | 0.0 /100 | #345 | Tragic $40,071 |