Hopi vs Spaniard Median Female Earnings
COMPARE
Hopi
Spaniard
Median Female Earnings
Median Female Earnings Comparison
Hopi
Spaniards
$33,932
MEDIAN FEMALE EARNINGS
0.0/ 100
METRIC RATING
329th/ 347
METRIC RANK
$38,656
MEDIAN FEMALE EARNINGS
10.3/ 100
METRIC RATING
215th/ 347
METRIC RANK
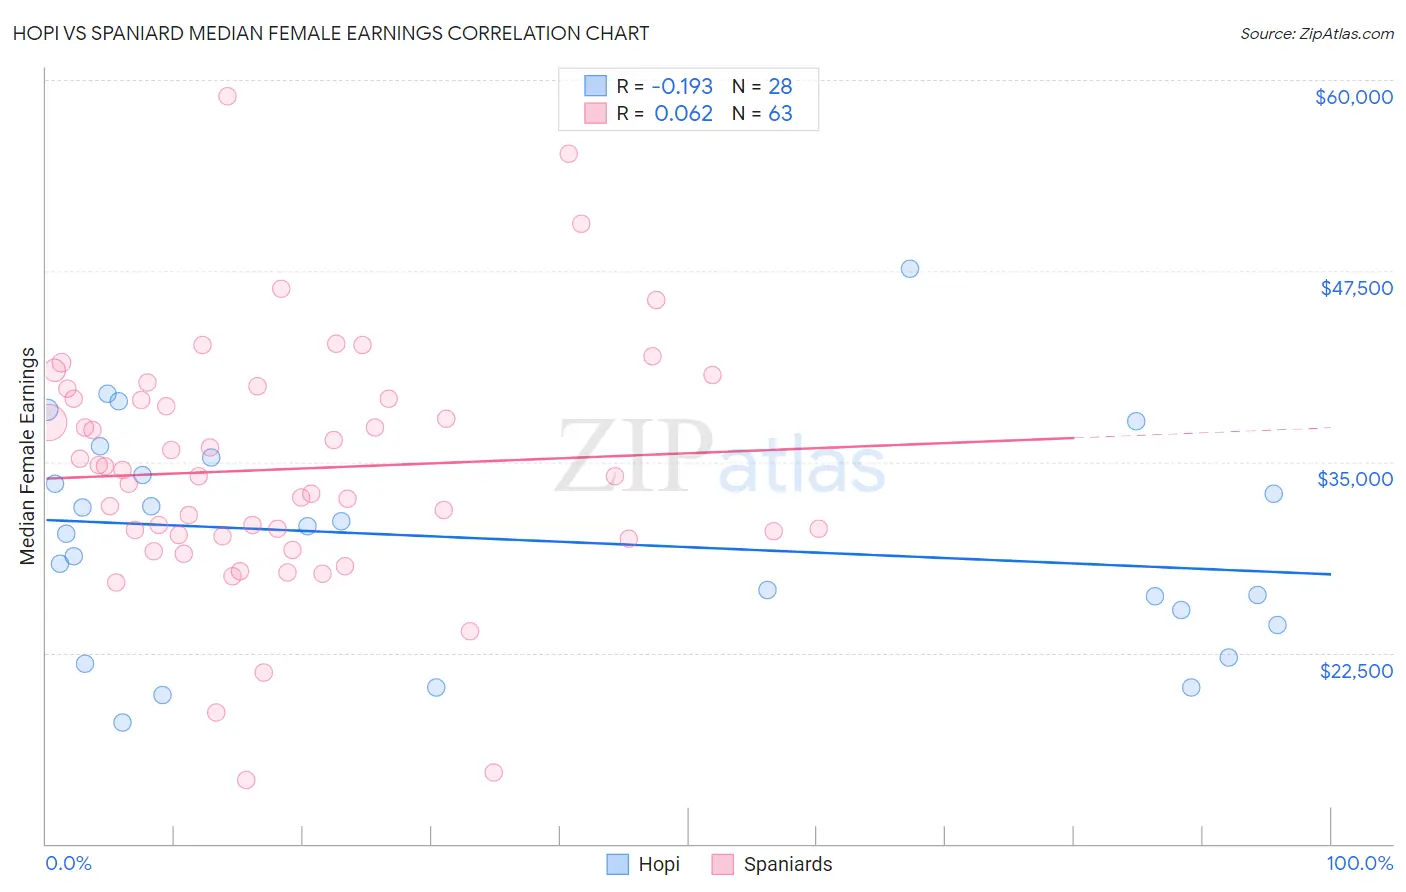
Hopi vs Spaniard Median Female Earnings Correlation Chart
The statistical analysis conducted on geographies consisting of 74,726,734 people shows a poor negative correlation between the proportion of Hopi and median female earnings in the United States with a correlation coefficient (R) of -0.193 and weighted average of $33,932. Similarly, the statistical analysis conducted on geographies consisting of 443,223,610 people shows a slight positive correlation between the proportion of Spaniards and median female earnings in the United States with a correlation coefficient (R) of 0.062 and weighted average of $38,656, a difference of 13.9%.
Median Female Earnings Correlation Summary
| Measurement | Hopi | Spaniard |
| Minimum | $17,917 | $14,192 |
| Maximum | $47,614 | $58,909 |
| Range | $29,697 | $44,717 |
| Mean | $29,933 | $34,527 |
| Median | $30,544 | $34,038 |
| Interquartile 25% (IQ1) | $24,802 | $30,169 |
| Interquartile 75% (IQ3) | $34,735 | $39,139 |
| Interquartile Range (IQR) | $9,933 | $8,970 |
| Standard Deviation (Sample) | $7,180 | $8,078 |
| Standard Deviation (Population) | $7,050 | $8,014 |
Similar Demographics by Median Female Earnings
Demographics Similar to Hopi by Median Female Earnings
In terms of median female earnings, the demographic groups most similar to Hopi are Immigrants from Central America ($33,953, a difference of 0.060%), Menominee ($33,894, a difference of 0.11%), Cajun ($34,034, a difference of 0.30%), Native/Alaskan ($33,806, a difference of 0.37%), and Kiowa ($34,074, a difference of 0.42%).
| Demographics | Rating | Rank | Median Female Earnings |
| Chickasaw | 0.0 /100 | #322 | Tragic $34,414 |
| Seminole | 0.0 /100 | #323 | Tragic $34,385 |
| Immigrants | Congo | 0.0 /100 | #324 | Tragic $34,317 |
| Dutch West Indians | 0.0 /100 | #325 | Tragic $34,106 |
| Kiowa | 0.0 /100 | #326 | Tragic $34,074 |
| Cajuns | 0.0 /100 | #327 | Tragic $34,034 |
| Immigrants | Central America | 0.0 /100 | #328 | Tragic $33,953 |
| Hopi | 0.0 /100 | #329 | Tragic $33,932 |
| Menominee | 0.0 /100 | #330 | Tragic $33,894 |
| Natives/Alaskans | 0.0 /100 | #331 | Tragic $33,806 |
| Choctaw | 0.0 /100 | #332 | Tragic $33,775 |
| Mexicans | 0.0 /100 | #333 | Tragic $33,664 |
| Spanish American Indians | 0.0 /100 | #334 | Tragic $33,625 |
| Creek | 0.0 /100 | #335 | Tragic $33,437 |
| Ottawa | 0.0 /100 | #336 | Tragic $33,378 |
Demographics Similar to Spaniards by Median Female Earnings
In terms of median female earnings, the demographic groups most similar to Spaniards are Iraqi ($38,666, a difference of 0.020%), Jamaican ($38,670, a difference of 0.030%), Immigrants from Ecuador ($38,644, a difference of 0.030%), Immigrants from Jamaica ($38,625, a difference of 0.080%), and Cape Verdean ($38,614, a difference of 0.11%).
| Demographics | Rating | Rank | Median Female Earnings |
| Immigrants | Thailand | 13.6 /100 | #208 | Poor $38,810 |
| Norwegians | 13.4 /100 | #209 | Poor $38,802 |
| Czechoslovakians | 12.0 /100 | #210 | Poor $38,738 |
| Aleuts | 11.6 /100 | #211 | Poor $38,719 |
| Guamanians/Chamorros | 11.5 /100 | #212 | Poor $38,717 |
| Jamaicans | 10.5 /100 | #213 | Poor $38,670 |
| Iraqis | 10.5 /100 | #214 | Poor $38,666 |
| Spaniards | 10.3 /100 | #215 | Poor $38,656 |
| Immigrants | Ecuador | 10.1 /100 | #216 | Poor $38,644 |
| Immigrants | Jamaica | 9.7 /100 | #217 | Tragic $38,625 |
| Cape Verdeans | 9.5 /100 | #218 | Tragic $38,614 |
| Nepalese | 9.3 /100 | #219 | Tragic $38,603 |
| Yugoslavians | 8.8 /100 | #220 | Tragic $38,573 |
| Immigrants | Azores | 8.8 /100 | #221 | Tragic $38,573 |
| Japanese | 8.1 /100 | #222 | Tragic $38,528 |