Filipino vs Lebanese Householder Income Under 25 years
COMPARE
Filipino
Lebanese
Householder Income Under 25 years
Householder Income Under 25 years Comparison
Filipinos
Lebanese
$57,740
HOUSEHOLDER INCOME UNDER 25 YEARS
100.0/ 100
METRIC RATING
14th/ 347
METRIC RANK
$50,355
HOUSEHOLDER INCOME UNDER 25 YEARS
1.1/ 100
METRIC RATING
257th/ 347
METRIC RANK
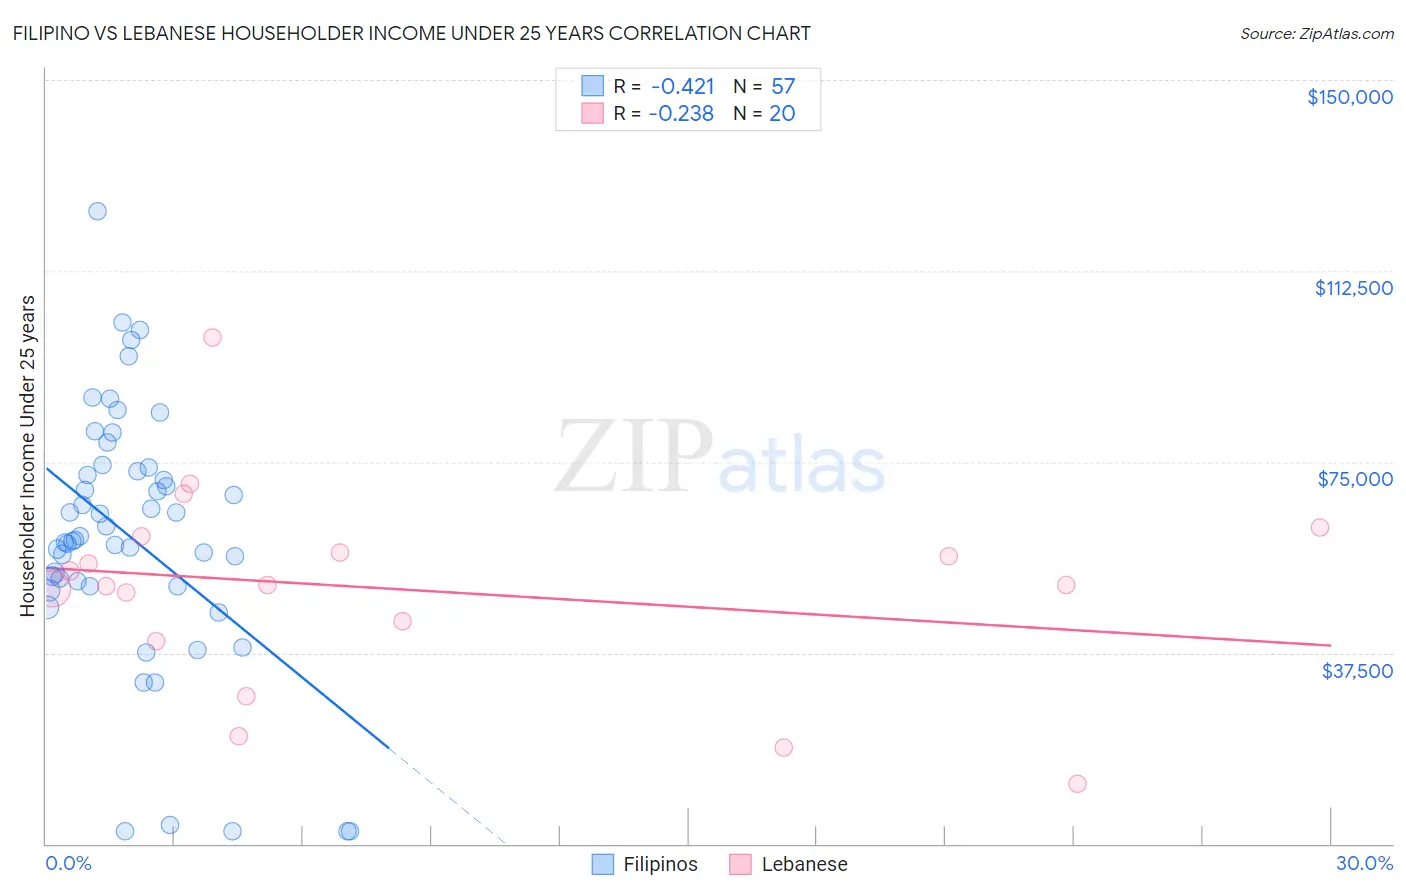
Filipino vs Lebanese Householder Income Under 25 years Correlation Chart
The statistical analysis conducted on geographies consisting of 221,803,900 people shows a moderate negative correlation between the proportion of Filipinos and household income with householder under the age of 25 in the United States with a correlation coefficient (R) of -0.421 and weighted average of $57,740. Similarly, the statistical analysis conducted on geographies consisting of 337,299,986 people shows a weak negative correlation between the proportion of Lebanese and household income with householder under the age of 25 in the United States with a correlation coefficient (R) of -0.238 and weighted average of $50,355, a difference of 14.7%.
Householder Income Under 25 years Correlation Summary
| Measurement | Filipino | Lebanese |
| Minimum | $2,499 | $11,835 |
| Maximum | $124,201 | $99,421 |
| Range | $121,702 | $87,586 |
| Mean | $60,102 | $49,958 |
| Median | $59,572 | $50,777 |
| Interquartile 25% (IQ1) | $50,565 | $41,651 |
| Interquartile 75% (IQ3) | $73,535 | $58,726 |
| Interquartile Range (IQR) | $22,969 | $17,075 |
| Standard Deviation (Sample) | $25,401 | $19,834 |
| Standard Deviation (Population) | $25,177 | $19,332 |
Similar Demographics by Householder Income Under 25 years
Demographics Similar to Filipinos by Householder Income Under 25 years
In terms of householder income under 25 years, the demographic groups most similar to Filipinos are Korean ($57,730, a difference of 0.020%), Immigrants from South Central Asia ($57,818, a difference of 0.14%), Immigrants from China ($57,931, a difference of 0.33%), Immigrants from Philippines ($57,930, a difference of 0.33%), and Immigrants from Afghanistan ($57,478, a difference of 0.46%).
| Demographics | Rating | Rank | Householder Income Under 25 years |
| Bolivians | 100.0 /100 | #7 | Exceptional $58,506 |
| Indians (Asian) | 100.0 /100 | #8 | Exceptional $58,239 |
| Chinese | 100.0 /100 | #9 | Exceptional $58,162 |
| Afghans | 100.0 /100 | #10 | Exceptional $58,019 |
| Immigrants | China | 100.0 /100 | #11 | Exceptional $57,931 |
| Immigrants | Philippines | 100.0 /100 | #12 | Exceptional $57,930 |
| Immigrants | South Central Asia | 100.0 /100 | #13 | Exceptional $57,818 |
| Filipinos | 100.0 /100 | #14 | Exceptional $57,740 |
| Koreans | 100.0 /100 | #15 | Exceptional $57,730 |
| Immigrants | Afghanistan | 100.0 /100 | #16 | Exceptional $57,478 |
| Sierra Leoneans | 100.0 /100 | #17 | Exceptional $57,272 |
| Immigrants | Eastern Asia | 100.0 /100 | #18 | Exceptional $57,123 |
| Bhutanese | 100.0 /100 | #19 | Exceptional $57,078 |
| Immigrants | Ireland | 100.0 /100 | #20 | Exceptional $57,075 |
| Immigrants | Fiji | 100.0 /100 | #21 | Exceptional $57,074 |
Demographics Similar to Lebanese by Householder Income Under 25 years
In terms of householder income under 25 years, the demographic groups most similar to Lebanese are Aleut ($50,377, a difference of 0.040%), Immigrants from Cuba ($50,374, a difference of 0.040%), White/Caucasian ($50,336, a difference of 0.040%), Luxembourger ($50,379, a difference of 0.050%), and Immigrants from Haiti ($50,398, a difference of 0.090%).
| Demographics | Rating | Rank | Householder Income Under 25 years |
| Immigrants | Cabo Verde | 1.7 /100 | #250 | Tragic $50,520 |
| Celtics | 1.4 /100 | #251 | Tragic $50,447 |
| Immigrants | Mexico | 1.3 /100 | #252 | Tragic $50,422 |
| Immigrants | Haiti | 1.2 /100 | #253 | Tragic $50,398 |
| Luxembourgers | 1.2 /100 | #254 | Tragic $50,379 |
| Aleuts | 1.2 /100 | #255 | Tragic $50,377 |
| Immigrants | Cuba | 1.2 /100 | #256 | Tragic $50,374 |
| Lebanese | 1.1 /100 | #257 | Tragic $50,355 |
| Whites/Caucasians | 1.1 /100 | #258 | Tragic $50,336 |
| Immigrants | Dominica | 1.0 /100 | #259 | Tragic $50,301 |
| Hispanics or Latinos | 0.9 /100 | #260 | Tragic $50,279 |
| Hungarians | 0.9 /100 | #261 | Tragic $50,247 |
| Haitians | 0.8 /100 | #262 | Tragic $50,231 |
| Immigrants | Dominican Republic | 0.8 /100 | #263 | Tragic $50,204 |
| Fijians | 0.6 /100 | #264 | Tragic $50,132 |