Czechoslovakian vs Immigrants from Northern Africa Median Female Earnings
COMPARE
Czechoslovakian
Immigrants from Northern Africa
Median Female Earnings
Median Female Earnings Comparison
Czechoslovakians
Immigrants from Northern Africa
$38,738
MEDIAN FEMALE EARNINGS
12.0/ 100
METRIC RATING
210th/ 347
METRIC RANK
$42,084
MEDIAN FEMALE EARNINGS
99.3/ 100
METRIC RATING
88th/ 347
METRIC RANK
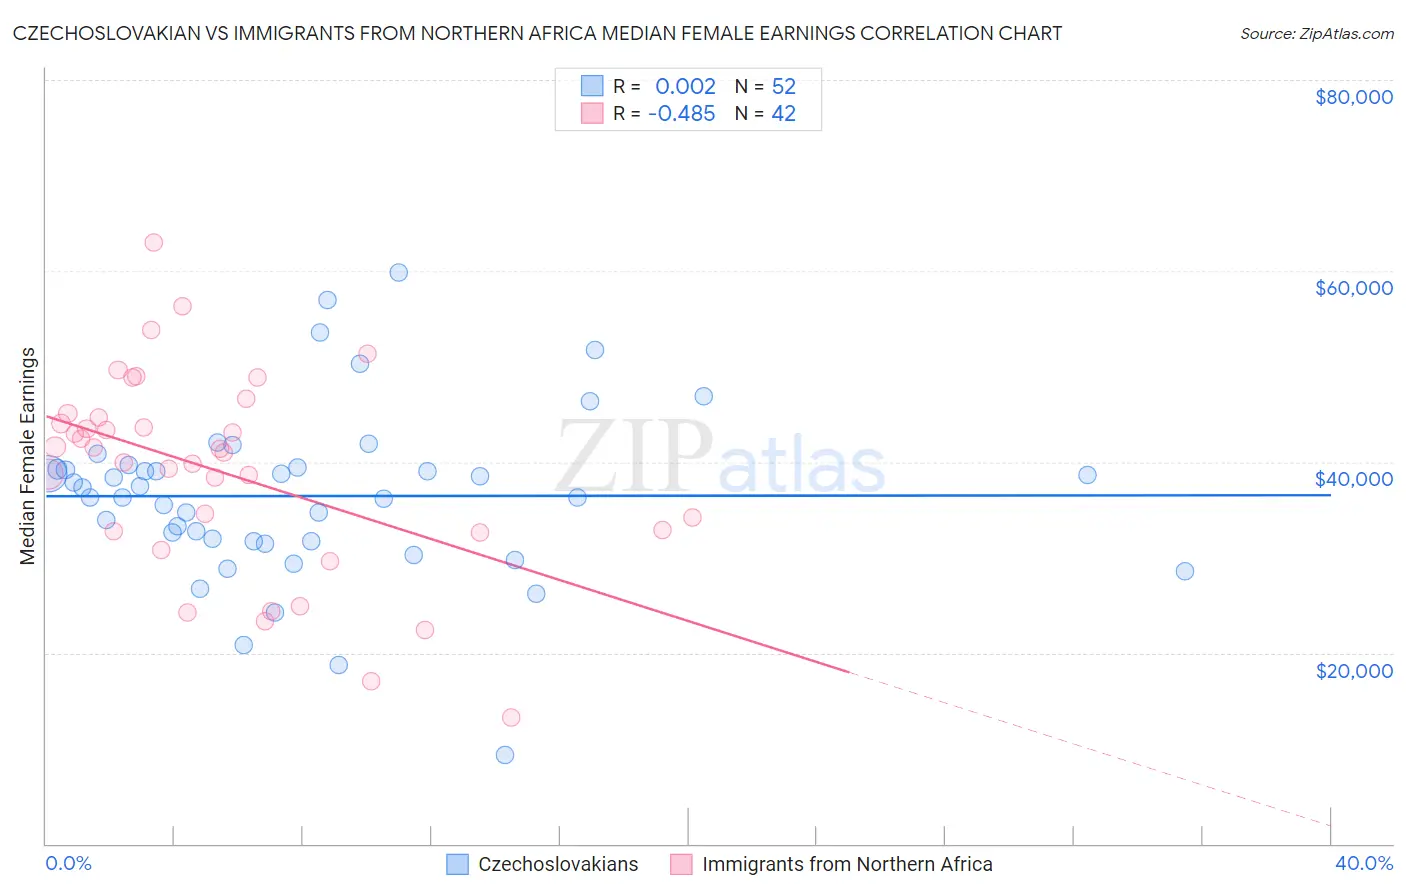
Czechoslovakian vs Immigrants from Northern Africa Median Female Earnings Correlation Chart
The statistical analysis conducted on geographies consisting of 368,499,928 people shows no correlation between the proportion of Czechoslovakians and median female earnings in the United States with a correlation coefficient (R) of 0.002 and weighted average of $38,738. Similarly, the statistical analysis conducted on geographies consisting of 321,137,511 people shows a moderate negative correlation between the proportion of Immigrants from Northern Africa and median female earnings in the United States with a correlation coefficient (R) of -0.485 and weighted average of $42,084, a difference of 8.6%.
Median Female Earnings Correlation Summary
| Measurement | Czechoslovakian | Immigrants from Northern Africa |
| Minimum | $9,297 | $13,173 |
| Maximum | $59,868 | $63,042 |
| Range | $50,571 | $49,869 |
| Mean | $36,417 | $38,964 |
| Median | $36,782 | $41,186 |
| Interquartile 25% (IQ1) | $31,695 | $32,684 |
| Interquartile 75% (IQ3) | $39,301 | $44,587 |
| Interquartile Range (IQR) | $7,606 | $11,903 |
| Standard Deviation (Sample) | $8,994 | $10,539 |
| Standard Deviation (Population) | $8,907 | $10,413 |
Similar Demographics by Median Female Earnings
Demographics Similar to Czechoslovakians by Median Female Earnings
In terms of median female earnings, the demographic groups most similar to Czechoslovakians are Aleut ($38,719, a difference of 0.050%), Guamanian/Chamorro ($38,717, a difference of 0.050%), Norwegian ($38,802, a difference of 0.17%), Jamaican ($38,670, a difference of 0.18%), and Immigrants from Thailand ($38,810, a difference of 0.19%).
| Demographics | Rating | Rank | Median Female Earnings |
| Czechs | 18.7 /100 | #203 | Poor $38,992 |
| Immigrants | Uruguay | 17.3 /100 | #204 | Poor $38,945 |
| Immigrants | Colombia | 16.3 /100 | #205 | Poor $38,913 |
| Immigrants | Bosnia and Herzegovina | 15.6 /100 | #206 | Poor $38,886 |
| Immigrants | Cambodia | 14.2 /100 | #207 | Poor $38,833 |
| Immigrants | Thailand | 13.6 /100 | #208 | Poor $38,810 |
| Norwegians | 13.4 /100 | #209 | Poor $38,802 |
| Czechoslovakians | 12.0 /100 | #210 | Poor $38,738 |
| Aleuts | 11.6 /100 | #211 | Poor $38,719 |
| Guamanians/Chamorros | 11.5 /100 | #212 | Poor $38,717 |
| Jamaicans | 10.5 /100 | #213 | Poor $38,670 |
| Iraqis | 10.5 /100 | #214 | Poor $38,666 |
| Spaniards | 10.3 /100 | #215 | Poor $38,656 |
| Immigrants | Ecuador | 10.1 /100 | #216 | Poor $38,644 |
| Immigrants | Jamaica | 9.7 /100 | #217 | Tragic $38,625 |
Demographics Similar to Immigrants from Northern Africa by Median Female Earnings
In terms of median female earnings, the demographic groups most similar to Immigrants from Northern Africa are Immigrants from St. Vincent and the Grenadines ($42,108, a difference of 0.060%), Lithuanian ($42,108, a difference of 0.060%), Immigrants from Afghanistan ($42,055, a difference of 0.070%), Laotian ($42,133, a difference of 0.12%), and Ukrainian ($42,015, a difference of 0.16%).
| Demographics | Rating | Rank | Median Female Earnings |
| Immigrants | Southern Europe | 99.5 /100 | #81 | Exceptional $42,275 |
| Immigrants | Morocco | 99.5 /100 | #82 | Exceptional $42,229 |
| Immigrants | Sierra Leone | 99.5 /100 | #83 | Exceptional $42,214 |
| Armenians | 99.5 /100 | #84 | Exceptional $42,212 |
| Laotians | 99.4 /100 | #85 | Exceptional $42,133 |
| Immigrants | St. Vincent and the Grenadines | 99.3 /100 | #86 | Exceptional $42,108 |
| Lithuanians | 99.3 /100 | #87 | Exceptional $42,108 |
| Immigrants | Northern Africa | 99.3 /100 | #88 | Exceptional $42,084 |
| Immigrants | Afghanistan | 99.3 /100 | #89 | Exceptional $42,055 |
| Ukrainians | 99.2 /100 | #90 | Exceptional $42,015 |
| Immigrants | Western Europe | 99.2 /100 | #91 | Exceptional $41,990 |
| Argentineans | 99.1 /100 | #92 | Exceptional $41,952 |
| Immigrants | Grenada | 99.0 /100 | #93 | Exceptional $41,932 |
| Moroccans | 98.9 /100 | #94 | Exceptional $41,872 |
| Immigrants | Netherlands | 98.9 /100 | #95 | Exceptional $41,870 |