Choctaw vs Immigrants from Pakistan Householder Income Under 25 years
COMPARE
Choctaw
Immigrants from Pakistan
Householder Income Under 25 years
Householder Income Under 25 years Comparison
Choctaw
Immigrants from Pakistan
$45,450
HOUSEHOLDER INCOME UNDER 25 YEARS
0.0/ 100
METRIC RATING
332nd/ 347
METRIC RANK
$56,789
HOUSEHOLDER INCOME UNDER 25 YEARS
100.0/ 100
METRIC RATING
25th/ 347
METRIC RANK
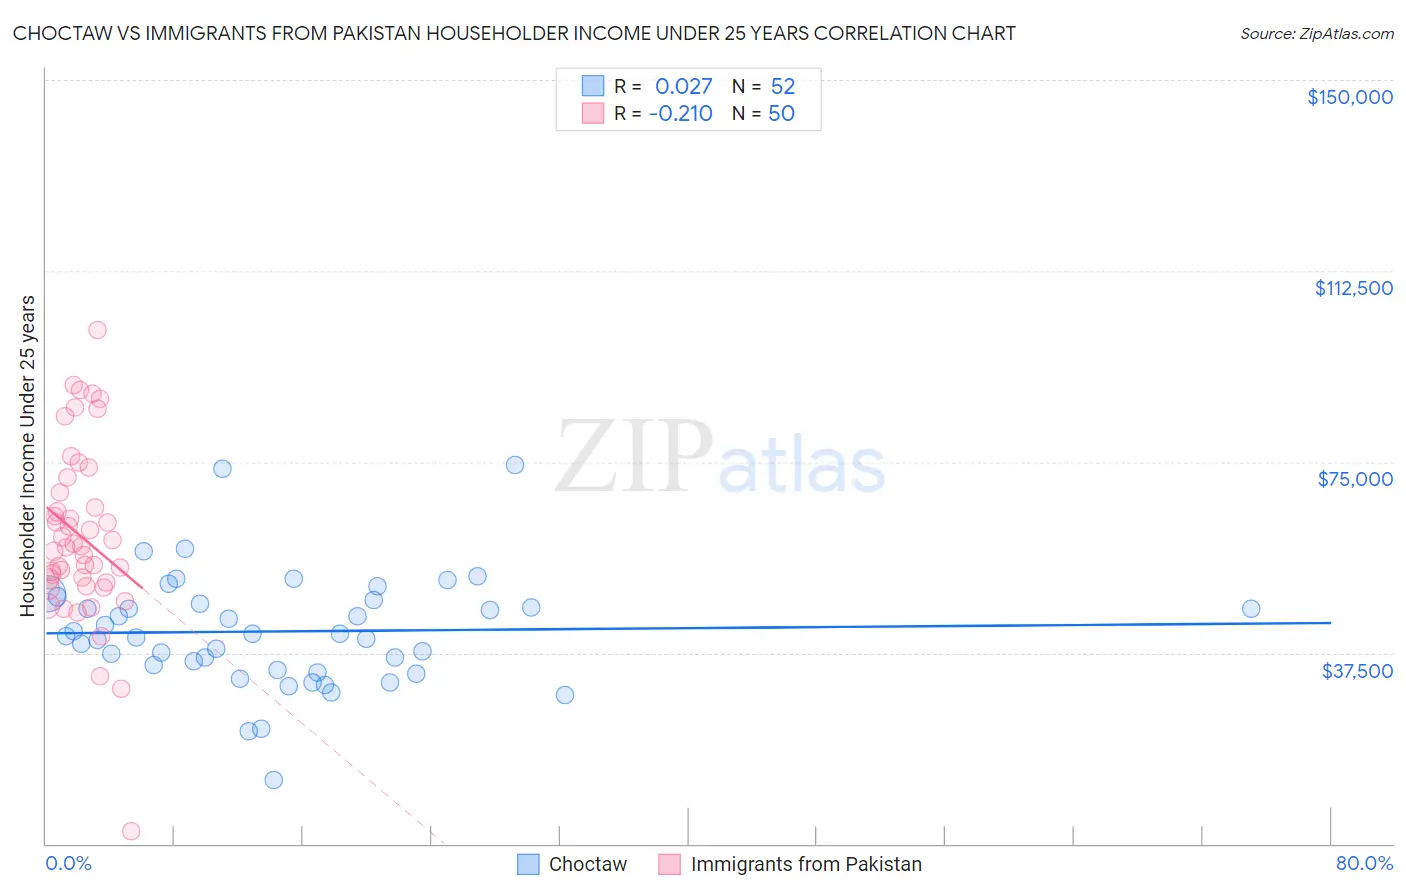
Choctaw vs Immigrants from Pakistan Householder Income Under 25 years Correlation Chart
The statistical analysis conducted on geographies consisting of 240,711,252 people shows no correlation between the proportion of Choctaw and household income with householder under the age of 25 in the United States with a correlation coefficient (R) of 0.027 and weighted average of $45,450. Similarly, the statistical analysis conducted on geographies consisting of 246,156,602 people shows a weak negative correlation between the proportion of Immigrants from Pakistan and household income with householder under the age of 25 in the United States with a correlation coefficient (R) of -0.210 and weighted average of $56,789, a difference of 24.9%.
Householder Income Under 25 years Correlation Summary
| Measurement | Choctaw | Immigrants from Pakistan |
| Minimum | $12,497 | $2,499 |
| Maximum | $74,375 | $100,795 |
| Range | $61,878 | $98,296 |
| Mean | $41,708 | $60,406 |
| Median | $41,033 | $58,281 |
| Interquartile 25% (IQ1) | $34,666 | $51,362 |
| Interquartile 75% (IQ3) | $47,474 | $69,066 |
| Interquartile Range (IQR) | $12,809 | $17,704 |
| Standard Deviation (Sample) | $11,126 | $17,398 |
| Standard Deviation (Population) | $11,019 | $17,223 |
Similar Demographics by Householder Income Under 25 years
Demographics Similar to Choctaw by Householder Income Under 25 years
In terms of householder income under 25 years, the demographic groups most similar to Choctaw are Immigrants from Zaire ($45,529, a difference of 0.17%), Creek ($45,371, a difference of 0.17%), Indonesian ($45,566, a difference of 0.25%), Cajun ($45,338, a difference of 0.25%), and Cheyenne ($45,275, a difference of 0.39%).
| Demographics | Rating | Rank | Householder Income Under 25 years |
| Immigrants | Bahamas | 0.0 /100 | #325 | Tragic $45,793 |
| Osage | 0.0 /100 | #326 | Tragic $45,764 |
| Bahamians | 0.0 /100 | #327 | Tragic $45,743 |
| German Russians | 0.0 /100 | #328 | Tragic $45,673 |
| Seminole | 0.0 /100 | #329 | Tragic $45,649 |
| Indonesians | 0.0 /100 | #330 | Tragic $45,566 |
| Immigrants | Zaire | 0.0 /100 | #331 | Tragic $45,529 |
| Choctaw | 0.0 /100 | #332 | Tragic $45,450 |
| Creek | 0.0 /100 | #333 | Tragic $45,371 |
| Cajuns | 0.0 /100 | #334 | Tragic $45,338 |
| Cheyenne | 0.0 /100 | #335 | Tragic $45,275 |
| Tohono O'odham | 0.0 /100 | #336 | Tragic $45,248 |
| Pueblo | 0.0 /100 | #337 | Tragic $45,018 |
| Chickasaw | 0.0 /100 | #338 | Tragic $44,763 |
| Kiowa | 0.0 /100 | #339 | Tragic $44,733 |
Demographics Similar to Immigrants from Pakistan by Householder Income Under 25 years
In terms of householder income under 25 years, the demographic groups most similar to Immigrants from Pakistan are Immigrants from Singapore ($56,835, a difference of 0.080%), Immigrants from Australia ($56,660, a difference of 0.23%), Tongan ($56,972, a difference of 0.32%), Asian ($57,003, a difference of 0.38%), and Immigrants from Ireland ($57,075, a difference of 0.50%).
| Demographics | Rating | Rank | Householder Income Under 25 years |
| Immigrants | Eastern Asia | 100.0 /100 | #18 | Exceptional $57,123 |
| Bhutanese | 100.0 /100 | #19 | Exceptional $57,078 |
| Immigrants | Ireland | 100.0 /100 | #20 | Exceptional $57,075 |
| Immigrants | Fiji | 100.0 /100 | #21 | Exceptional $57,074 |
| Asians | 100.0 /100 | #22 | Exceptional $57,003 |
| Tongans | 100.0 /100 | #23 | Exceptional $56,972 |
| Immigrants | Singapore | 100.0 /100 | #24 | Exceptional $56,835 |
| Immigrants | Pakistan | 100.0 /100 | #25 | Exceptional $56,789 |
| Immigrants | Australia | 100.0 /100 | #26 | Exceptional $56,660 |
| Immigrants | North Macedonia | 100.0 /100 | #27 | Exceptional $56,503 |
| Immigrants | Peru | 100.0 /100 | #28 | Exceptional $56,384 |
| Immigrants | Asia | 100.0 /100 | #29 | Exceptional $56,379 |
| Immigrants | Moldova | 100.0 /100 | #30 | Exceptional $56,168 |
| Vietnamese | 100.0 /100 | #31 | Exceptional $56,127 |
| Peruvians | 100.0 /100 | #32 | Exceptional $56,052 |