Choctaw vs Immigrants from Croatia Householder Income Under 25 years
COMPARE
Choctaw
Immigrants from Croatia
Householder Income Under 25 years
Householder Income Under 25 years Comparison
Choctaw
Immigrants from Croatia
$45,450
HOUSEHOLDER INCOME UNDER 25 YEARS
0.0/ 100
METRIC RATING
332nd/ 347
METRIC RANK
$54,343
HOUSEHOLDER INCOME UNDER 25 YEARS
99.5/ 100
METRIC RATING
86th/ 347
METRIC RANK
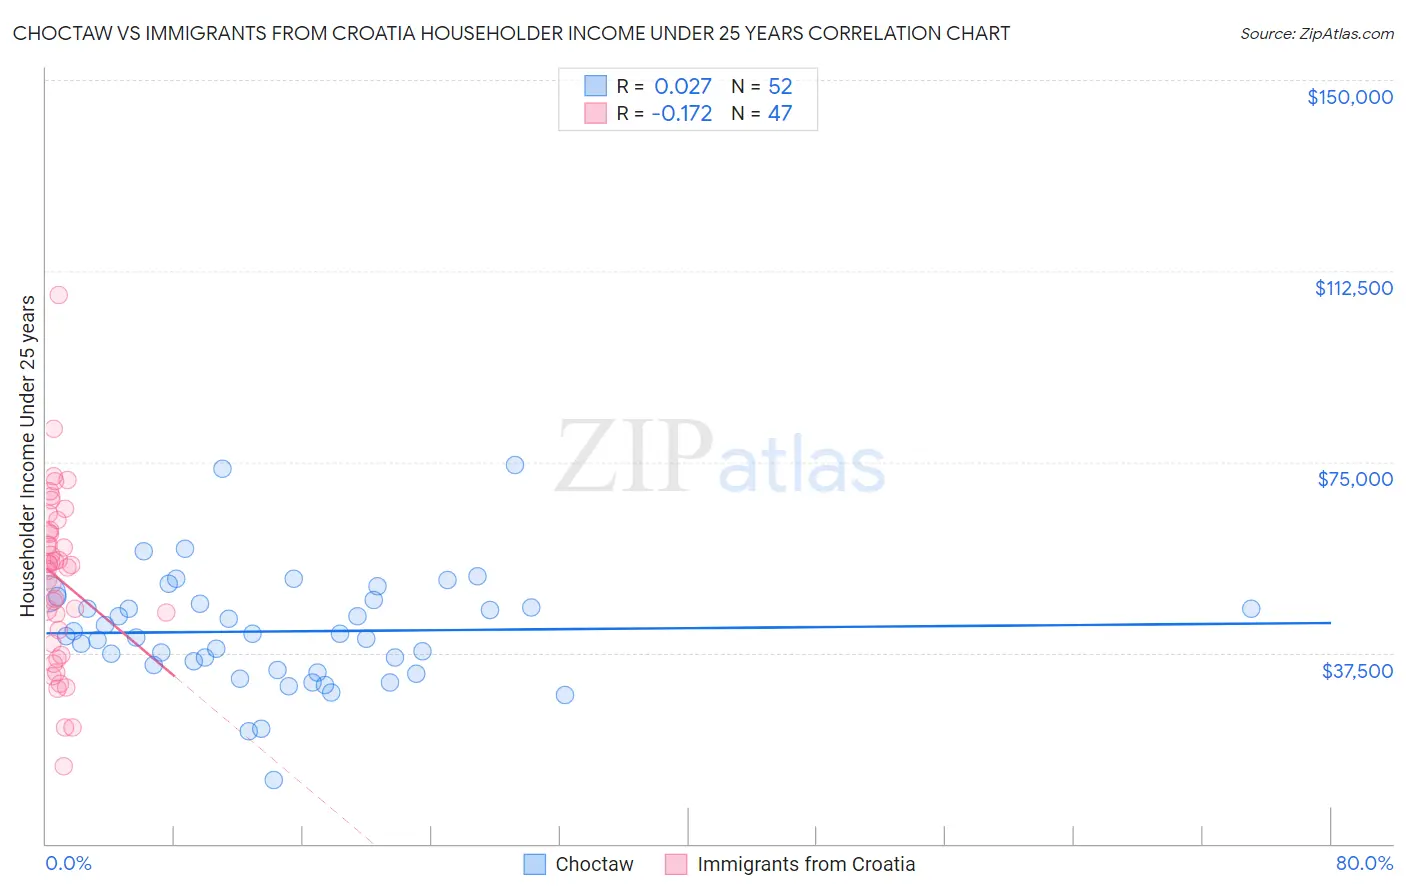
Choctaw vs Immigrants from Croatia Householder Income Under 25 years Correlation Chart
The statistical analysis conducted on geographies consisting of 240,711,252 people shows no correlation between the proportion of Choctaw and household income with householder under the age of 25 in the United States with a correlation coefficient (R) of 0.027 and weighted average of $45,450. Similarly, the statistical analysis conducted on geographies consisting of 118,934,083 people shows a poor negative correlation between the proportion of Immigrants from Croatia and household income with householder under the age of 25 in the United States with a correlation coefficient (R) of -0.172 and weighted average of $54,343, a difference of 19.6%.
Householder Income Under 25 years Correlation Summary
| Measurement | Choctaw | Immigrants from Croatia |
| Minimum | $12,497 | $15,272 |
| Maximum | $74,375 | $107,708 |
| Range | $61,878 | $92,436 |
| Mean | $41,708 | $52,110 |
| Median | $41,033 | $54,625 |
| Interquartile 25% (IQ1) | $34,666 | $39,284 |
| Interquartile 75% (IQ3) | $47,474 | $61,539 |
| Interquartile Range (IQR) | $12,809 | $22,255 |
| Standard Deviation (Sample) | $11,126 | $16,944 |
| Standard Deviation (Population) | $11,019 | $16,763 |
Similar Demographics by Householder Income Under 25 years
Demographics Similar to Choctaw by Householder Income Under 25 years
In terms of householder income under 25 years, the demographic groups most similar to Choctaw are Immigrants from Zaire ($45,529, a difference of 0.17%), Creek ($45,371, a difference of 0.17%), Indonesian ($45,566, a difference of 0.25%), Cajun ($45,338, a difference of 0.25%), and Cheyenne ($45,275, a difference of 0.39%).
| Demographics | Rating | Rank | Householder Income Under 25 years |
| Immigrants | Bahamas | 0.0 /100 | #325 | Tragic $45,793 |
| Osage | 0.0 /100 | #326 | Tragic $45,764 |
| Bahamians | 0.0 /100 | #327 | Tragic $45,743 |
| German Russians | 0.0 /100 | #328 | Tragic $45,673 |
| Seminole | 0.0 /100 | #329 | Tragic $45,649 |
| Indonesians | 0.0 /100 | #330 | Tragic $45,566 |
| Immigrants | Zaire | 0.0 /100 | #331 | Tragic $45,529 |
| Choctaw | 0.0 /100 | #332 | Tragic $45,450 |
| Creek | 0.0 /100 | #333 | Tragic $45,371 |
| Cajuns | 0.0 /100 | #334 | Tragic $45,338 |
| Cheyenne | 0.0 /100 | #335 | Tragic $45,275 |
| Tohono O'odham | 0.0 /100 | #336 | Tragic $45,248 |
| Pueblo | 0.0 /100 | #337 | Tragic $45,018 |
| Chickasaw | 0.0 /100 | #338 | Tragic $44,763 |
| Kiowa | 0.0 /100 | #339 | Tragic $44,733 |
Demographics Similar to Immigrants from Croatia by Householder Income Under 25 years
In terms of householder income under 25 years, the demographic groups most similar to Immigrants from Croatia are Bulgarian ($54,352, a difference of 0.020%), Immigrants from Czechoslovakia ($54,352, a difference of 0.020%), Brazilian ($54,335, a difference of 0.020%), Yakama ($54,321, a difference of 0.040%), and Laotian ($54,369, a difference of 0.050%).
| Demographics | Rating | Rank | Householder Income Under 25 years |
| Immigrants | Italy | 99.6 /100 | #79 | Exceptional $54,449 |
| Egyptians | 99.6 /100 | #80 | Exceptional $54,444 |
| Portuguese | 99.6 /100 | #81 | Exceptional $54,436 |
| Russians | 99.5 /100 | #82 | Exceptional $54,389 |
| Laotians | 99.5 /100 | #83 | Exceptional $54,369 |
| Bulgarians | 99.5 /100 | #84 | Exceptional $54,352 |
| Immigrants | Czechoslovakia | 99.5 /100 | #85 | Exceptional $54,352 |
| Immigrants | Croatia | 99.5 /100 | #86 | Exceptional $54,343 |
| Brazilians | 99.5 /100 | #87 | Exceptional $54,335 |
| Yakama | 99.5 /100 | #88 | Exceptional $54,321 |
| Immigrants | South America | 99.4 /100 | #89 | Exceptional $54,268 |
| Turks | 99.4 /100 | #90 | Exceptional $54,266 |
| Immigrants | Egypt | 99.3 /100 | #91 | Exceptional $54,239 |
| Immigrants | St. Vincent and the Grenadines | 99.3 /100 | #92 | Exceptional $54,230 |
| Immigrants | Argentina | 99.3 /100 | #93 | Exceptional $54,209 |