Arab vs Spanish Per Capita Income
COMPARE
Arab
Spanish
Per Capita Income
Per Capita Income Comparison
Arabs
Spanish
$45,662
PER CAPITA INCOME
90.4/ 100
METRIC RATING
130th/ 347
METRIC RANK
$42,249
PER CAPITA INCOME
17.0/ 100
METRIC RATING
203rd/ 347
METRIC RANK
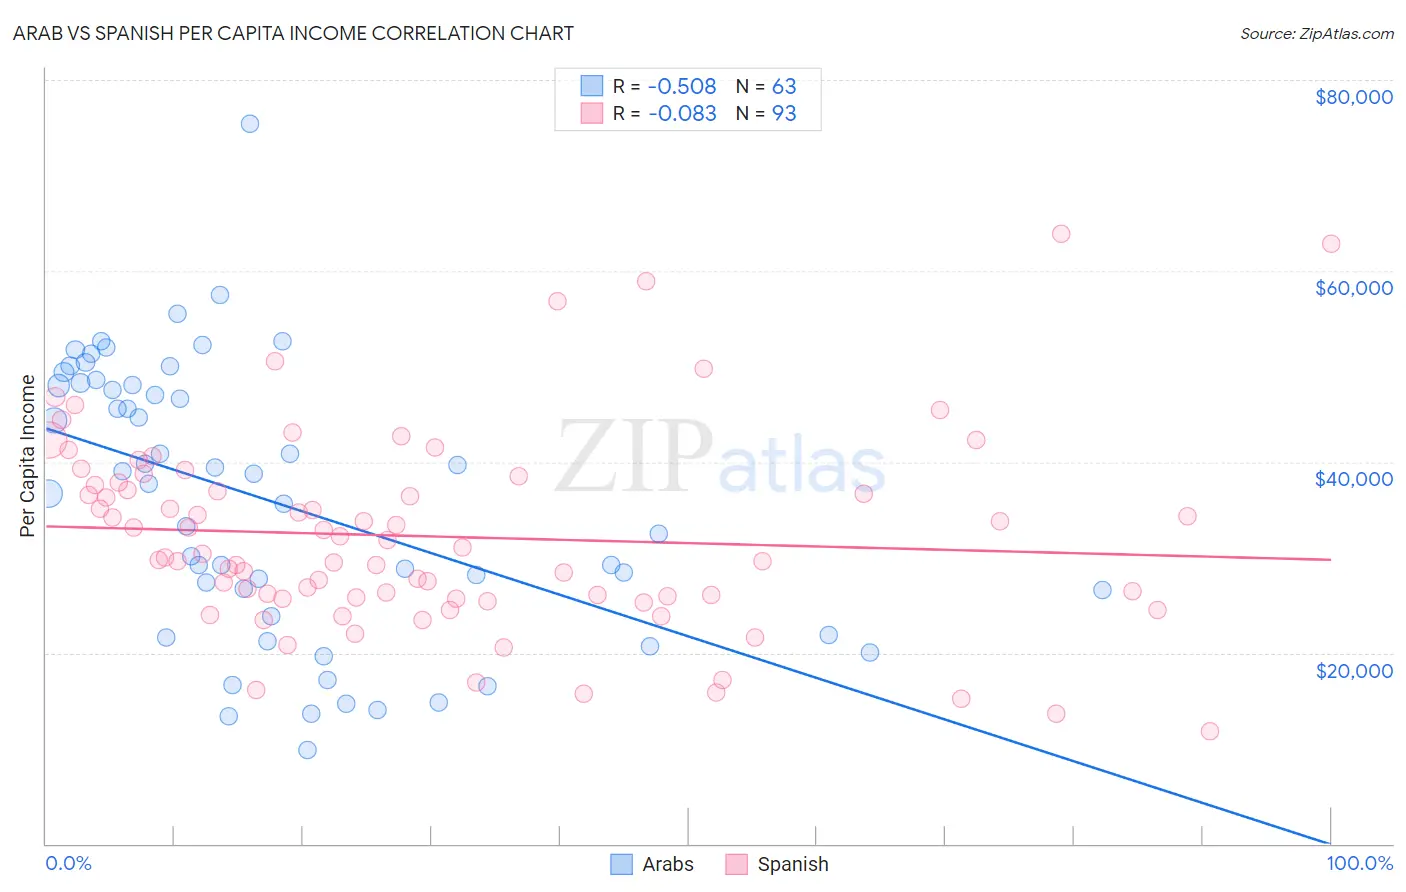
Arab vs Spanish Per Capita Income Correlation Chart
The statistical analysis conducted on geographies consisting of 486,915,485 people shows a substantial negative correlation between the proportion of Arabs and per capita income in the United States with a correlation coefficient (R) of -0.508 and weighted average of $45,662. Similarly, the statistical analysis conducted on geographies consisting of 422,211,321 people shows a slight negative correlation between the proportion of Spanish and per capita income in the United States with a correlation coefficient (R) of -0.083 and weighted average of $42,249, a difference of 8.1%.
Per Capita Income Correlation Summary
| Measurement | Arab | Spanish |
| Minimum | $9,805 | $11,849 |
| Maximum | $75,372 | $63,855 |
| Range | $65,567 | $52,006 |
| Mean | $35,873 | $32,202 |
| Median | $37,723 | $30,353 |
| Interquartile 25% (IQ1) | $23,895 | $25,756 |
| Interquartile 75% (IQ3) | $48,040 | $37,741 |
| Interquartile Range (IQR) | $24,145 | $11,984 |
| Standard Deviation (Sample) | $14,217 | $10,280 |
| Standard Deviation (Population) | $14,103 | $10,225 |
Similar Demographics by Per Capita Income
Demographics Similar to Arabs by Per Capita Income
In terms of per capita income, the demographic groups most similar to Arabs are Luxembourger ($45,663, a difference of 0.0%), Immigrants from North Macedonia ($45,622, a difference of 0.090%), Jordanian ($45,605, a difference of 0.12%), Pakistani ($45,587, a difference of 0.16%), and Slovene ($45,581, a difference of 0.18%).
| Demographics | Rating | Rank | Per Capita Income |
| Lebanese | 92.0 /100 | #123 | Exceptional $45,840 |
| Europeans | 92.0 /100 | #124 | Exceptional $45,836 |
| Zimbabweans | 91.7 /100 | #125 | Exceptional $45,804 |
| Palestinians | 91.6 /100 | #126 | Exceptional $45,790 |
| Immigrants | Germany | 91.3 /100 | #127 | Exceptional $45,751 |
| Swedes | 91.3 /100 | #128 | Exceptional $45,750 |
| Luxembourgers | 90.4 /100 | #129 | Exceptional $45,663 |
| Arabs | 90.4 /100 | #130 | Exceptional $45,662 |
| Immigrants | North Macedonia | 90.0 /100 | #131 | Exceptional $45,622 |
| Jordanians | 89.9 /100 | #132 | Excellent $45,605 |
| Pakistanis | 89.7 /100 | #133 | Excellent $45,587 |
| Slovenes | 89.6 /100 | #134 | Excellent $45,581 |
| Hungarians | 87.9 /100 | #135 | Excellent $45,426 |
| Immigrants | Oceania | 85.2 /100 | #136 | Excellent $45,220 |
| Immigrants | Syria | 85.2 /100 | #137 | Excellent $45,218 |
Demographics Similar to Spanish by Per Capita Income
In terms of per capita income, the demographic groups most similar to Spanish are Immigrants from Bosnia and Herzegovina ($42,278, a difference of 0.070%), Immigrants from Thailand ($42,289, a difference of 0.090%), Aleut ($42,210, a difference of 0.090%), White/Caucasian ($42,180, a difference of 0.16%), and Ghanaian ($42,164, a difference of 0.20%).
| Demographics | Rating | Rank | Per Capita Income |
| Dutch | 23.4 /100 | #196 | Fair $42,605 |
| Scotch-Irish | 22.6 /100 | #197 | Fair $42,563 |
| Immigrants | Portugal | 19.7 /100 | #198 | Poor $42,412 |
| Barbadians | 19.6 /100 | #199 | Poor $42,406 |
| Vietnamese | 19.0 /100 | #200 | Poor $42,368 |
| Immigrants | Thailand | 17.6 /100 | #201 | Poor $42,289 |
| Immigrants | Bosnia and Herzegovina | 17.5 /100 | #202 | Poor $42,278 |
| Spanish | 17.0 /100 | #203 | Poor $42,249 |
| Aleuts | 16.4 /100 | #204 | Poor $42,210 |
| Whites/Caucasians | 15.9 /100 | #205 | Poor $42,180 |
| Ghanaians | 15.7 /100 | #206 | Poor $42,164 |
| Venezuelans | 14.4 /100 | #207 | Poor $42,074 |
| Panamanians | 13.9 /100 | #208 | Poor $42,035 |
| Immigrants | Sudan | 13.2 /100 | #209 | Poor $41,986 |
| Ecuadorians | 12.9 /100 | #210 | Poor $41,958 |