Yaqui vs Ottawa Family Households with Children
COMPARE
Yaqui
Ottawa
Family Households with Children
Family Households with Children Comparison
Yaqui
Ottawa
29.1%
FAMILY HOUSEHOLDS WITH CHILDREN
100.0/ 100
METRIC RATING
39th/ 347
METRIC RANK
26.1%
FAMILY HOUSEHOLDS WITH CHILDREN
0.0/ 100
METRIC RATING
317th/ 347
METRIC RANK
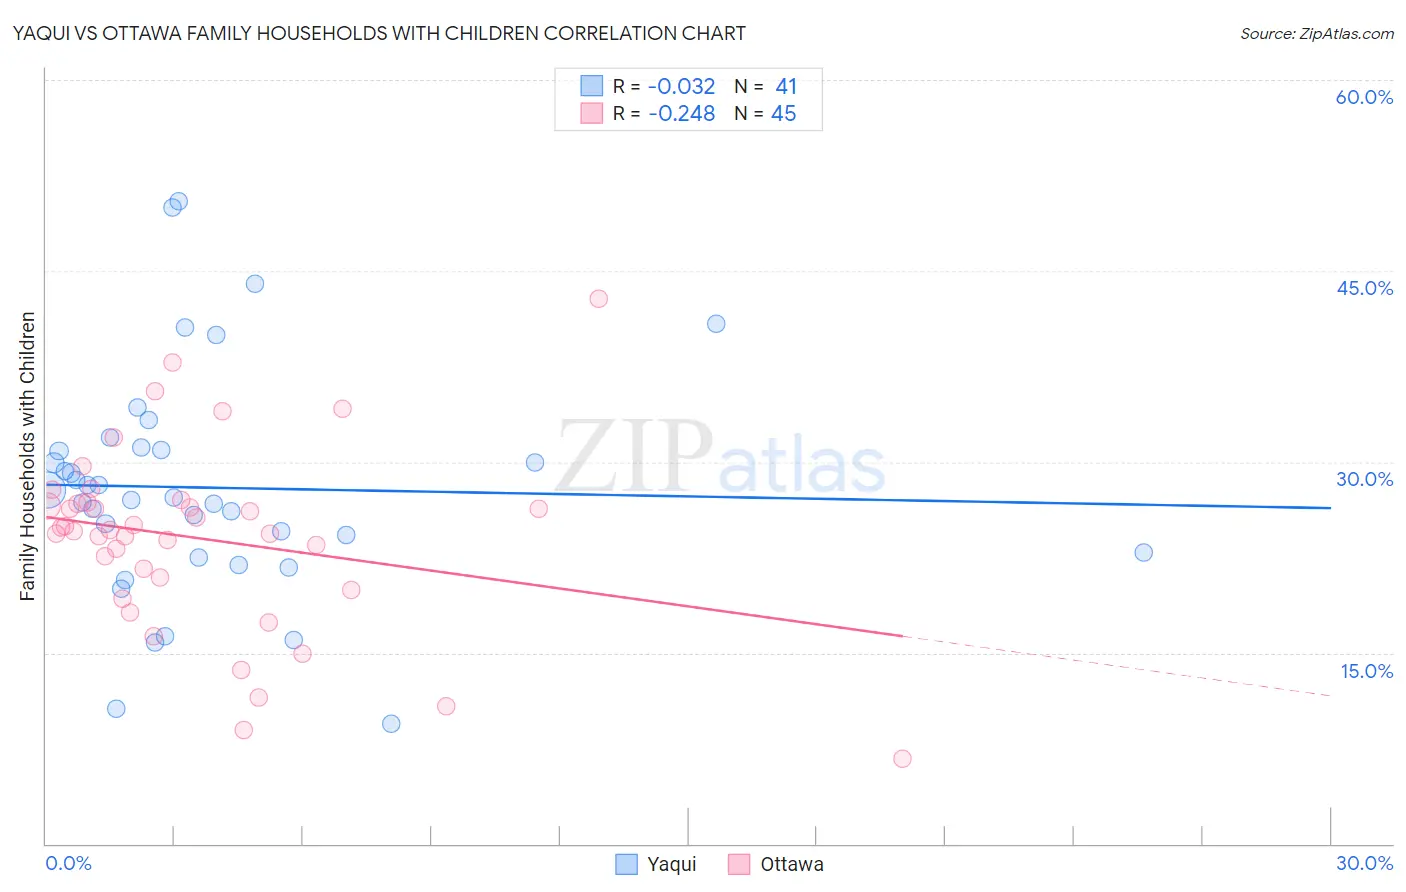
Yaqui vs Ottawa Family Households with Children Correlation Chart
The statistical analysis conducted on geographies consisting of 107,712,127 people shows no correlation between the proportion of Yaqui and percentage of family households with children in the United States with a correlation coefficient (R) of -0.032 and weighted average of 29.1%. Similarly, the statistical analysis conducted on geographies consisting of 49,929,923 people shows a weak negative correlation between the proportion of Ottawa and percentage of family households with children in the United States with a correlation coefficient (R) of -0.248 and weighted average of 26.1%, a difference of 11.8%.
Family Households with Children Correlation Summary
| Measurement | Yaqui | Ottawa |
| Minimum | 9.4% | 6.7% |
| Maximum | 50.5% | 42.9% |
| Range | 41.1% | 36.2% |
| Mean | 28.0% | 24.0% |
| Median | 27.2% | 24.6% |
| Interquartile 25% (IQ1) | 22.7% | 20.4% |
| Interquartile 75% (IQ3) | 31.0% | 26.8% |
| Interquartile Range (IQR) | 8.3% | 6.4% |
| Standard Deviation (Sample) | 8.9% | 7.3% |
| Standard Deviation (Population) | 8.8% | 7.2% |
Similar Demographics by Family Households with Children
Demographics Similar to Yaqui by Family Households with Children
In terms of family households with children, the demographic groups most similar to Yaqui are Central American (29.1%, a difference of 0.010%), Immigrants from South Eastern Asia (29.1%, a difference of 0.10%), Spanish American Indian (29.1%, a difference of 0.11%), Korean (29.2%, a difference of 0.15%), and Immigrants from Cameroon (29.2%, a difference of 0.29%).
| Demographics | Rating | Rank | Family Households with Children |
| Immigrants | Yemen | 100.0 /100 | #32 | Exceptional 29.4% |
| Venezuelans | 100.0 /100 | #33 | Exceptional 29.4% |
| Immigrants | Bolivia | 100.0 /100 | #34 | Exceptional 29.3% |
| Immigrants | Sierra Leone | 100.0 /100 | #35 | Exceptional 29.3% |
| Immigrants | Venezuela | 100.0 /100 | #36 | Exceptional 29.3% |
| Immigrants | Cameroon | 100.0 /100 | #37 | Exceptional 29.2% |
| Koreans | 100.0 /100 | #38 | Exceptional 29.2% |
| Yaqui | 100.0 /100 | #39 | Exceptional 29.1% |
| Central Americans | 100.0 /100 | #40 | Exceptional 29.1% |
| Immigrants | South Eastern Asia | 100.0 /100 | #41 | Exceptional 29.1% |
| Spanish American Indians | 100.0 /100 | #42 | Exceptional 29.1% |
| Asians | 100.0 /100 | #43 | Exceptional 29.1% |
| Immigrants | Taiwan | 100.0 /100 | #44 | Exceptional 29.0% |
| Fijians | 100.0 /100 | #45 | Exceptional 29.0% |
| Immigrants | Philippines | 100.0 /100 | #46 | Exceptional 29.0% |
Demographics Similar to Ottawa by Family Households with Children
In terms of family households with children, the demographic groups most similar to Ottawa are Iroquois (26.1%, a difference of 0.050%), Estonian (26.1%, a difference of 0.090%), Immigrants from France (26.0%, a difference of 0.14%), Tlingit-Haida (26.0%, a difference of 0.15%), and Immigrants from Norway (26.1%, a difference of 0.17%).
| Demographics | Rating | Rank | Family Households with Children |
| Marshallese | 0.0 /100 | #310 | Tragic 26.2% |
| Colville | 0.0 /100 | #311 | Tragic 26.2% |
| Immigrants | Czechoslovakia | 0.0 /100 | #312 | Tragic 26.2% |
| Cree | 0.0 /100 | #313 | Tragic 26.2% |
| French Canadians | 0.0 /100 | #314 | Tragic 26.1% |
| Immigrants | Norway | 0.0 /100 | #315 | Tragic 26.1% |
| Estonians | 0.0 /100 | #316 | Tragic 26.1% |
| Ottawa | 0.0 /100 | #317 | Tragic 26.1% |
| Iroquois | 0.0 /100 | #318 | Tragic 26.1% |
| Immigrants | France | 0.0 /100 | #319 | Tragic 26.0% |
| Tlingit-Haida | 0.0 /100 | #320 | Tragic 26.0% |
| British West Indians | 0.0 /100 | #321 | Tragic 26.0% |
| Immigrants | Greece | 0.0 /100 | #322 | Tragic 26.0% |
| Immigrants | Australia | 0.0 /100 | #323 | Tragic 26.0% |
| Chinese | 0.0 /100 | #324 | Tragic 26.0% |