Immigrants from Croatia vs Ottawa Family Households with Children
COMPARE
Immigrants from Croatia
Ottawa
Family Households with Children
Family Households with Children Comparison
Immigrants from Croatia
Ottawa
25.7%
FAMILY HOUSEHOLDS WITH CHILDREN
0.0/ 100
METRIC RATING
335th/ 347
METRIC RANK
26.1%
FAMILY HOUSEHOLDS WITH CHILDREN
0.0/ 100
METRIC RATING
317th/ 347
METRIC RANK
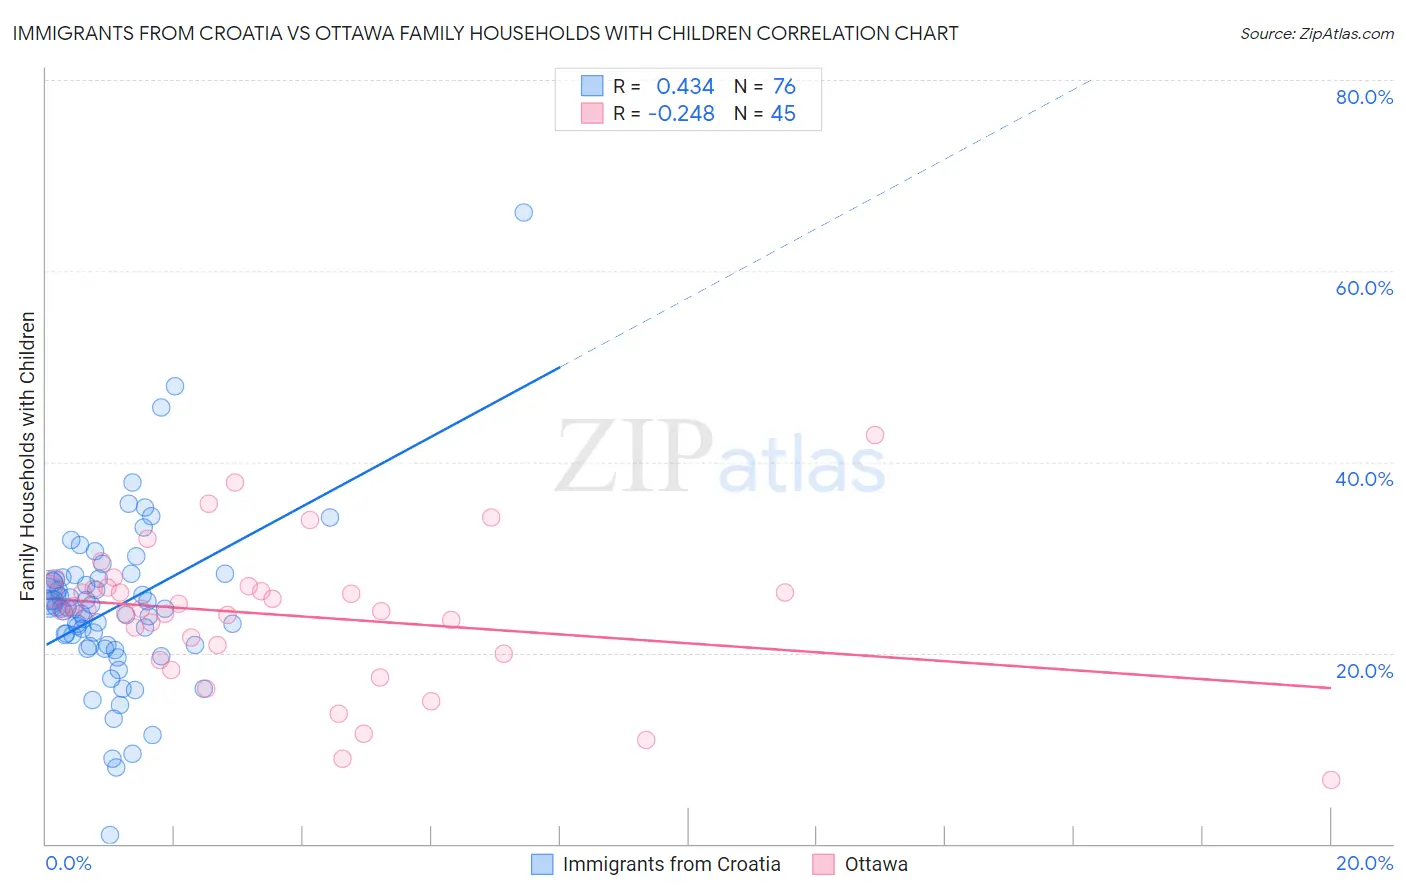
Immigrants from Croatia vs Ottawa Family Households with Children Correlation Chart
The statistical analysis conducted on geographies consisting of 132,550,122 people shows a moderate positive correlation between the proportion of Immigrants from Croatia and percentage of family households with children in the United States with a correlation coefficient (R) of 0.434 and weighted average of 25.7%. Similarly, the statistical analysis conducted on geographies consisting of 49,929,923 people shows a weak negative correlation between the proportion of Ottawa and percentage of family households with children in the United States with a correlation coefficient (R) of -0.248 and weighted average of 26.1%, a difference of 1.5%.
Family Households with Children Correlation Summary
| Measurement | Immigrants from Croatia | Ottawa |
| Minimum | 0.93% | 6.7% |
| Maximum | 66.1% | 42.9% |
| Range | 65.1% | 36.2% |
| Mean | 24.7% | 24.0% |
| Median | 24.6% | 24.6% |
| Interquartile 25% (IQ1) | 20.7% | 20.4% |
| Interquartile 75% (IQ3) | 27.7% | 26.8% |
| Interquartile Range (IQR) | 7.0% | 6.4% |
| Standard Deviation (Sample) | 8.9% | 7.3% |
| Standard Deviation (Population) | 8.9% | 7.2% |
Demographics Similar to Immigrants from Croatia and Ottawa by Family Households with Children
In terms of family households with children, the demographic groups most similar to Immigrants from Croatia are Slovak (25.7%, a difference of 0.010%), Immigrants from West Indies (25.7%, a difference of 0.10%), Immigrants from Switzerland (25.7%, a difference of 0.16%), Immigrants from Austria (25.8%, a difference of 0.24%), and Slovene (25.8%, a difference of 0.47%). Similarly, the demographic groups most similar to Ottawa are Iroquois (26.1%, a difference of 0.050%), Estonian (26.1%, a difference of 0.090%), Immigrants from France (26.0%, a difference of 0.14%), Tlingit-Haida (26.0%, a difference of 0.15%), and British West Indian (26.0%, a difference of 0.17%).
| Demographics | Rating | Rank | Family Households with Children |
| Estonians | 0.0 /100 | #316 | Tragic 26.1% |
| Ottawa | 0.0 /100 | #317 | Tragic 26.1% |
| Iroquois | 0.0 /100 | #318 | Tragic 26.1% |
| Immigrants | France | 0.0 /100 | #319 | Tragic 26.0% |
| Tlingit-Haida | 0.0 /100 | #320 | Tragic 26.0% |
| British West Indians | 0.0 /100 | #321 | Tragic 26.0% |
| Immigrants | Greece | 0.0 /100 | #322 | Tragic 26.0% |
| Immigrants | Australia | 0.0 /100 | #323 | Tragic 26.0% |
| Chinese | 0.0 /100 | #324 | Tragic 26.0% |
| Barbadians | 0.0 /100 | #325 | Tragic 26.0% |
| Immigrants | Ireland | 0.0 /100 | #326 | Tragic 26.0% |
| Immigrants | Barbados | 0.0 /100 | #327 | Tragic 26.0% |
| Immigrants | Albania | 0.0 /100 | #328 | Tragic 25.9% |
| Cypriots | 0.0 /100 | #329 | Tragic 25.9% |
| Immigrants | Latvia | 0.0 /100 | #330 | Tragic 25.9% |
| Slovenes | 0.0 /100 | #331 | Tragic 25.8% |
| Immigrants | Austria | 0.0 /100 | #332 | Tragic 25.8% |
| Immigrants | Switzerland | 0.0 /100 | #333 | Tragic 25.7% |
| Slovaks | 0.0 /100 | #334 | Tragic 25.7% |
| Immigrants | Croatia | 0.0 /100 | #335 | Tragic 25.7% |
| Immigrants | West Indies | 0.0 /100 | #336 | Tragic 25.7% |