Tsimshian vs Maltese Births to Unmarried Women
COMPARE
Tsimshian
Maltese
Births to Unmarried Women
Births to Unmarried Women Comparison
Tsimshian
Maltese
42.2%
BIRTHS TO UNMARRIED WOMEN
0.0/ 100
METRIC RATING
327th/ 347
METRIC RANK
27.8%
BIRTHS TO UNMARRIED WOMEN
99.4/ 100
METRIC RATING
50th/ 347
METRIC RANK
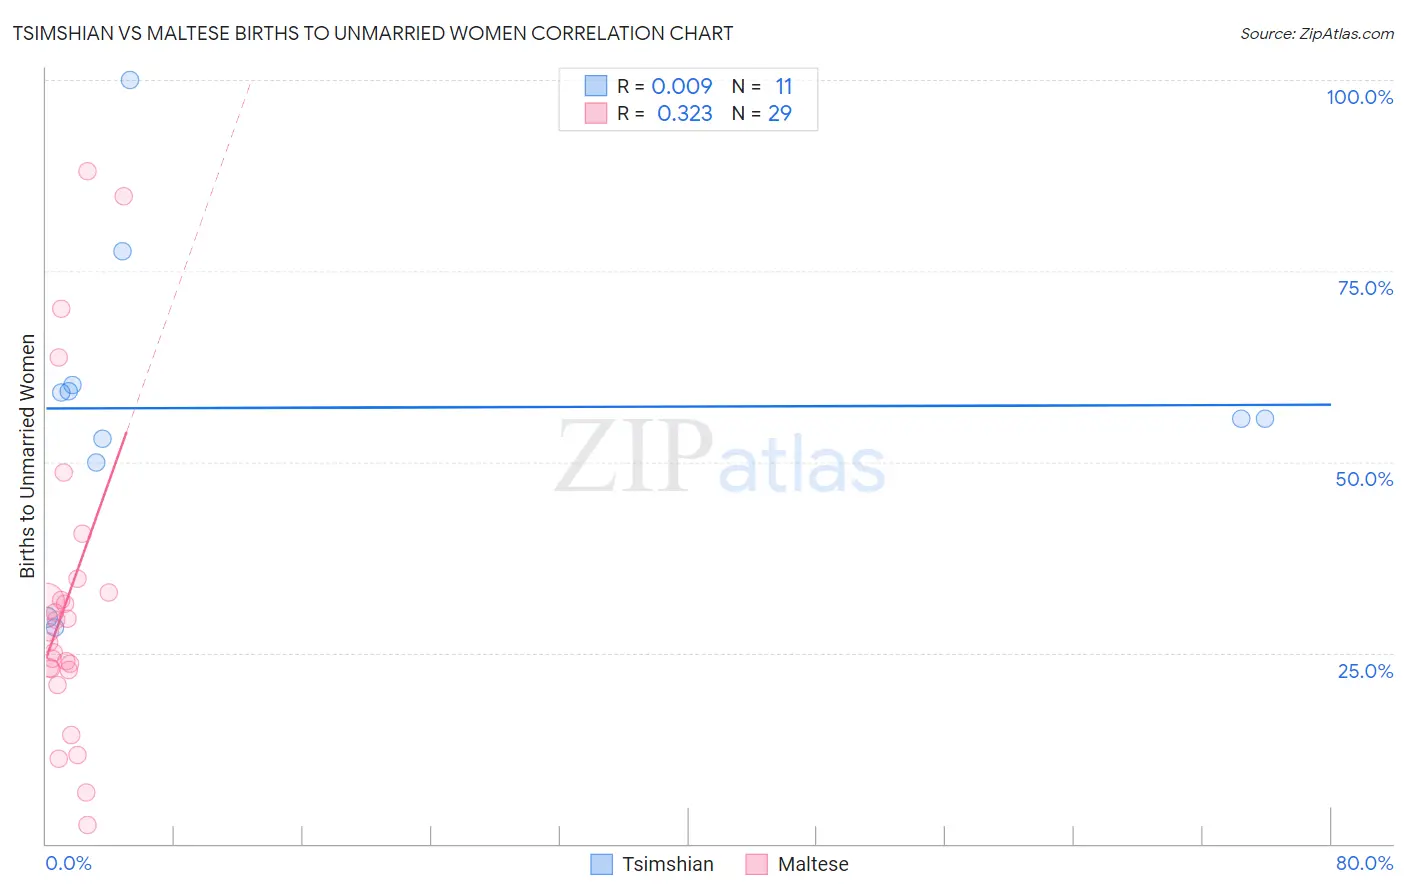
Tsimshian vs Maltese Births to Unmarried Women Correlation Chart
The statistical analysis conducted on geographies consisting of 15,351,381 people shows no correlation between the proportion of Tsimshian and percentage of births to unmarried women in the United States with a correlation coefficient (R) of 0.009 and weighted average of 42.2%. Similarly, the statistical analysis conducted on geographies consisting of 121,147,000 people shows a mild positive correlation between the proportion of Maltese and percentage of births to unmarried women in the United States with a correlation coefficient (R) of 0.323 and weighted average of 27.8%, a difference of 51.5%.
Births to Unmarried Women Correlation Summary
| Measurement | Tsimshian | Maltese |
| Minimum | 28.3% | 2.4% |
| Maximum | 100.0% | 88.0% |
| Range | 71.7% | 85.6% |
| Mean | 57.1% | 32.2% |
| Median | 55.6% | 27.6% |
| Interquartile 25% (IQ1) | 50.0% | 22.9% |
| Interquartile 75% (IQ3) | 60.0% | 33.8% |
| Interquartile Range (IQR) | 10.0% | 10.9% |
| Standard Deviation (Sample) | 19.8% | 20.8% |
| Standard Deviation (Population) | 18.9% | 20.4% |
Similar Demographics by Births to Unmarried Women
Demographics Similar to Tsimshian by Births to Unmarried Women
In terms of births to unmarried women, the demographic groups most similar to Tsimshian are Immigrants from Cabo Verde (42.2%, a difference of 0.13%), Paiute (42.5%, a difference of 0.74%), Chippewa (42.6%, a difference of 1.1%), Immigrants from Cuba (41.5%, a difference of 1.7%), and Cheyenne (41.3%, a difference of 1.9%).
| Demographics | Rating | Rank | Births to Unmarried Women |
| Crow | 0.0 /100 | #320 | Tragic 40.4% |
| Bahamians | 0.0 /100 | #321 | Tragic 40.8% |
| Cajuns | 0.0 /100 | #322 | Tragic 41.0% |
| Sioux | 0.0 /100 | #323 | Tragic 41.0% |
| Cape Verdeans | 0.0 /100 | #324 | Tragic 41.3% |
| Cheyenne | 0.0 /100 | #325 | Tragic 41.3% |
| Immigrants | Cuba | 0.0 /100 | #326 | Tragic 41.5% |
| Tsimshian | 0.0 /100 | #327 | Tragic 42.2% |
| Immigrants | Cabo Verde | 0.0 /100 | #328 | Tragic 42.2% |
| Paiute | 0.0 /100 | #329 | Tragic 42.5% |
| Chippewa | 0.0 /100 | #330 | Tragic 42.6% |
| Natives/Alaskans | 0.0 /100 | #331 | Tragic 43.0% |
| Kiowa | 0.0 /100 | #332 | Tragic 43.1% |
| Blacks/African Americans | 0.0 /100 | #333 | Tragic 44.3% |
| Yuman | 0.0 /100 | #334 | Tragic 44.4% |
Demographics Similar to Maltese by Births to Unmarried Women
In terms of births to unmarried women, the demographic groups most similar to Maltese are Immigrants from Greece (27.8%, a difference of 0.12%), Macedonian (27.9%, a difference of 0.13%), Bhutanese (27.9%, a difference of 0.17%), Immigrants from Romania (27.9%, a difference of 0.19%), and Afghan (27.9%, a difference of 0.25%).
| Demographics | Rating | Rank | Births to Unmarried Women |
| Immigrants | Bulgaria | 99.6 /100 | #43 | Exceptional 27.6% |
| Immigrants | Indonesia | 99.5 /100 | #44 | Exceptional 27.7% |
| Latvians | 99.5 /100 | #45 | Exceptional 27.7% |
| Immigrants | Lithuania | 99.5 /100 | #46 | Exceptional 27.7% |
| Hmong | 99.5 /100 | #47 | Exceptional 27.7% |
| Eastern Europeans | 99.5 /100 | #48 | Exceptional 27.7% |
| Immigrants | Greece | 99.4 /100 | #49 | Exceptional 27.8% |
| Maltese | 99.4 /100 | #50 | Exceptional 27.8% |
| Macedonians | 99.4 /100 | #51 | Exceptional 27.9% |
| Bhutanese | 99.4 /100 | #52 | Exceptional 27.9% |
| Immigrants | Romania | 99.4 /100 | #53 | Exceptional 27.9% |
| Afghans | 99.4 /100 | #54 | Exceptional 27.9% |
| Mongolians | 99.3 /100 | #55 | Exceptional 27.9% |
| Immigrants | Belgium | 99.3 /100 | #56 | Exceptional 28.0% |
| Russians | 99.2 /100 | #57 | Exceptional 28.0% |