Subsaharan African vs Immigrants from Ethiopia Single Father Households
COMPARE
Subsaharan African
Immigrants from Ethiopia
Single Father Households
Single Father Households Comparison
Sub-Saharan Africans
Immigrants from Ethiopia
2.4%
SINGLE FATHER HOUSEHOLDS
8.3/ 100
METRIC RATING
230th/ 347
METRIC RANK
2.4%
SINGLE FATHER HOUSEHOLDS
13.4/ 100
METRIC RATING
218th/ 347
METRIC RANK
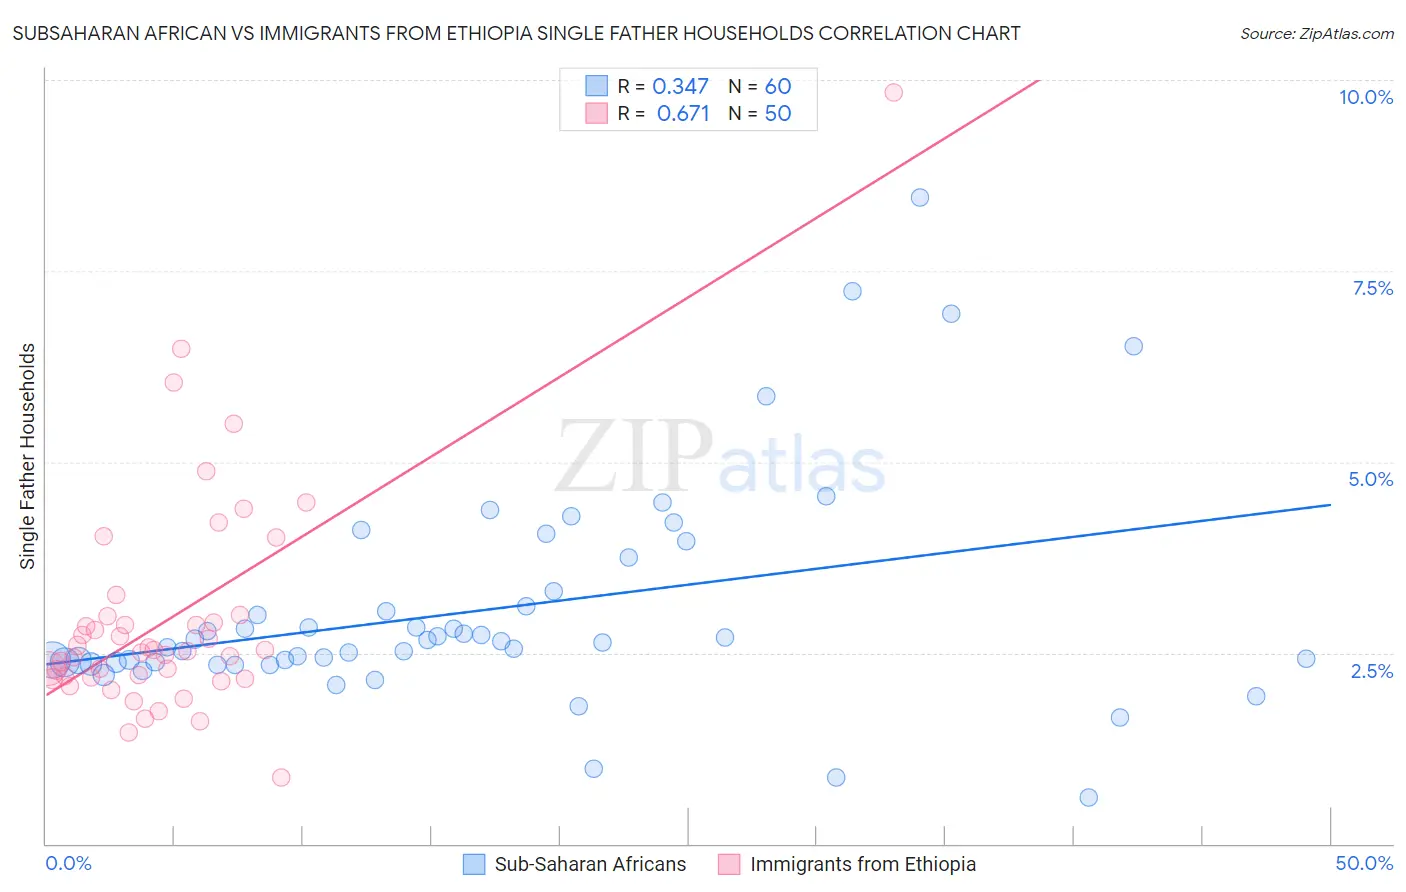
Subsaharan African vs Immigrants from Ethiopia Single Father Households Correlation Chart
The statistical analysis conducted on geographies consisting of 500,994,896 people shows a mild positive correlation between the proportion of Sub-Saharan Africans and percentage of single father households in the United States with a correlation coefficient (R) of 0.347 and weighted average of 2.4%. Similarly, the statistical analysis conducted on geographies consisting of 210,806,493 people shows a significant positive correlation between the proportion of Immigrants from Ethiopia and percentage of single father households in the United States with a correlation coefficient (R) of 0.671 and weighted average of 2.4%, a difference of 0.96%.
Single Father Households Correlation Summary
| Measurement | Subsaharan African | Immigrants from Ethiopia |
| Minimum | 0.60% | 0.87% |
| Maximum | 8.5% | 9.8% |
| Range | 7.9% | 9.0% |
| Mean | 3.1% | 3.0% |
| Median | 2.6% | 2.5% |
| Interquartile 25% (IQ1) | 2.4% | 2.2% |
| Interquartile 75% (IQ3) | 3.2% | 3.0% |
| Interquartile Range (IQR) | 0.83% | 0.79% |
| Standard Deviation (Sample) | 1.5% | 1.5% |
| Standard Deviation (Population) | 1.4% | 1.5% |
Demographics Similar to Sub-Saharan Africans and Immigrants from Ethiopia by Single Father Households
In terms of single father households, the demographic groups most similar to Sub-Saharan Africans are Immigrants from Zaire (2.4%, a difference of 0.090%), Nonimmigrants (2.4%, a difference of 0.16%), Immigrants from Ghana (2.4%, a difference of 0.20%), American (2.4%, a difference of 0.24%), and Pennsylvania German (2.4%, a difference of 0.25%). Similarly, the demographic groups most similar to Immigrants from Ethiopia are Sudanese (2.4%, a difference of 0.070%), Ghanaian (2.4%, a difference of 0.080%), Dutch (2.4%, a difference of 0.13%), Immigrants from Burma/Myanmar (2.4%, a difference of 0.21%), and Immigrants from Ecuador (2.4%, a difference of 0.22%).
| Demographics | Rating | Rank | Single Father Households |
| Ethiopians | 16.6 /100 | #214 | Poor 2.4% |
| Immigrants | South Eastern Asia | 15.9 /100 | #215 | Poor 2.4% |
| Immigrants | Ecuador | 14.9 /100 | #216 | Poor 2.4% |
| Dutch | 14.3 /100 | #217 | Poor 2.4% |
| Immigrants | Ethiopia | 13.4 /100 | #218 | Poor 2.4% |
| Sudanese | 13.0 /100 | #219 | Poor 2.4% |
| Ghanaians | 12.9 /100 | #220 | Poor 2.4% |
| Immigrants | Burma/Myanmar | 12.1 /100 | #221 | Poor 2.4% |
| Immigrants | Eastern Africa | 11.9 /100 | #222 | Poor 2.4% |
| Immigrants | Uruguay | 11.0 /100 | #223 | Poor 2.4% |
| Immigrants | Bahamas | 10.6 /100 | #224 | Poor 2.4% |
| Marshallese | 9.7 /100 | #225 | Tragic 2.4% |
| Blacks/African Americans | 9.7 /100 | #226 | Tragic 2.4% |
| Americans | 9.3 /100 | #227 | Tragic 2.4% |
| Immigrants | Ghana | 9.1 /100 | #228 | Tragic 2.4% |
| Immigrants | Zaire | 8.6 /100 | #229 | Tragic 2.4% |
| Sub-Saharan Africans | 8.3 /100 | #230 | Tragic 2.4% |
| Immigrants | Nonimmigrants | 7.6 /100 | #231 | Tragic 2.4% |
| Pennsylvania Germans | 7.3 /100 | #232 | Tragic 2.4% |
| Immigrants | Western Africa | 7.0 /100 | #233 | Tragic 2.4% |
| Africans | 6.3 /100 | #234 | Tragic 2.5% |