Spanish American Indian vs Canadian Family Households with Children
COMPARE
Spanish American Indian
Canadian
Family Households with Children
Family Households with Children Comparison
Spanish American Indians
Canadians
29.1%
FAMILY HOUSEHOLDS WITH CHILDREN
100.0/ 100
METRIC RATING
42nd/ 347
METRIC RANK
27.1%
FAMILY HOUSEHOLDS WITH CHILDREN
7.5/ 100
METRIC RATING
225th/ 347
METRIC RANK
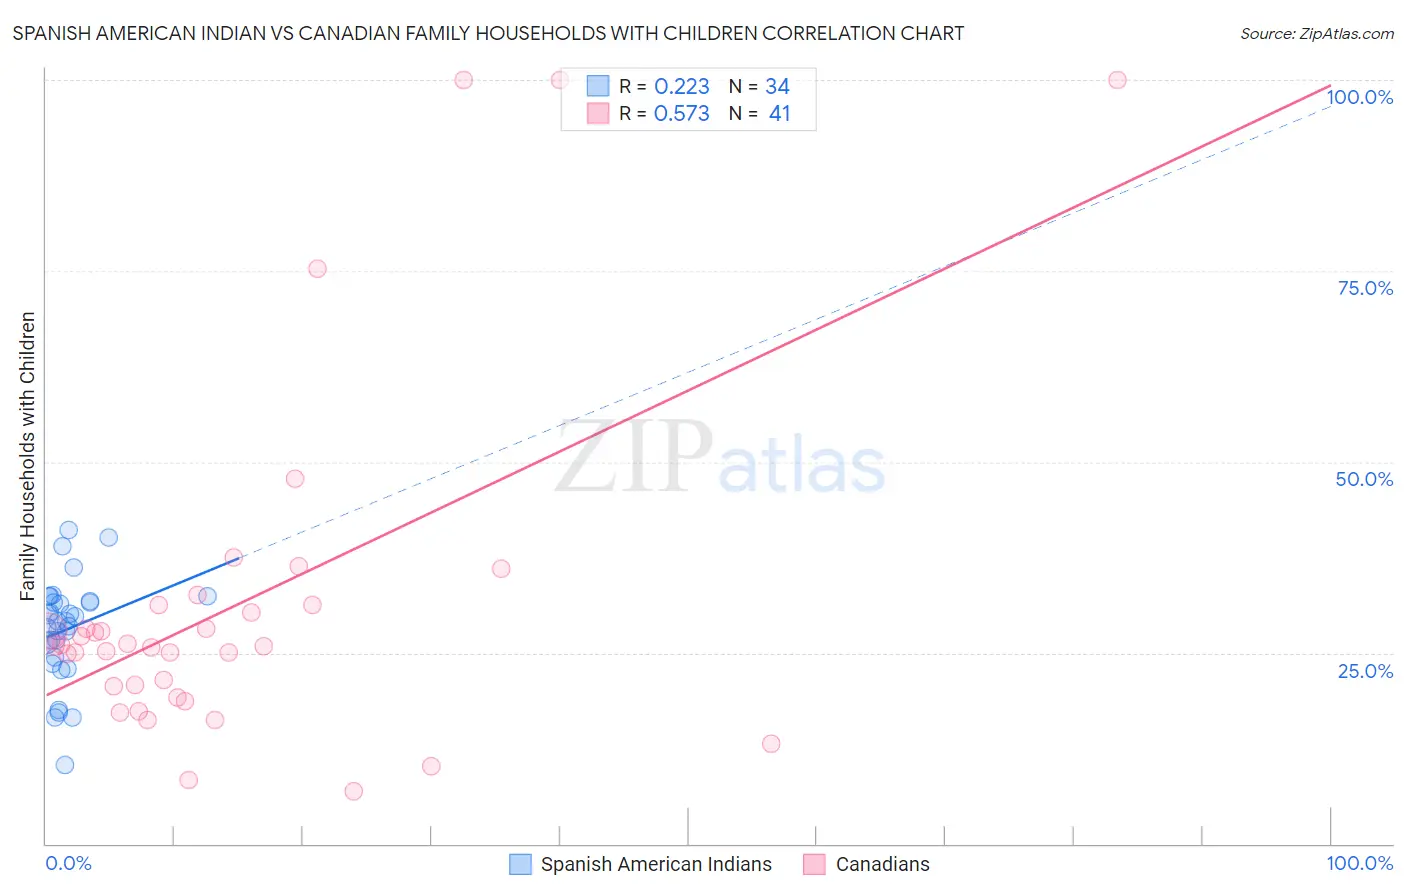
Spanish American Indian vs Canadian Family Households with Children Correlation Chart
The statistical analysis conducted on geographies consisting of 73,143,666 people shows a weak positive correlation between the proportion of Spanish American Indians and percentage of family households with children in the United States with a correlation coefficient (R) of 0.223 and weighted average of 29.1%. Similarly, the statistical analysis conducted on geographies consisting of 437,085,688 people shows a substantial positive correlation between the proportion of Canadians and percentage of family households with children in the United States with a correlation coefficient (R) of 0.573 and weighted average of 27.1%, a difference of 7.5%.
Family Households with Children Correlation Summary
| Measurement | Spanish American Indian | Canadian |
| Minimum | 10.3% | 6.9% |
| Maximum | 41.0% | 100.0% |
| Range | 30.8% | 93.1% |
| Mean | 28.1% | 31.4% |
| Median | 29.2% | 26.0% |
| Interquartile 25% (IQ1) | 24.4% | 19.9% |
| Interquartile 75% (IQ3) | 31.7% | 31.3% |
| Interquartile Range (IQR) | 7.3% | 11.4% |
| Standard Deviation (Sample) | 6.8% | 22.5% |
| Standard Deviation (Population) | 6.7% | 22.2% |
Similar Demographics by Family Households with Children
Demographics Similar to Spanish American Indians by Family Households with Children
In terms of family households with children, the demographic groups most similar to Spanish American Indians are Immigrants from South Eastern Asia (29.1%, a difference of 0.0%), Central American (29.1%, a difference of 0.090%), Yaqui (29.1%, a difference of 0.11%), Asian (29.1%, a difference of 0.19%), and Immigrants from Taiwan (29.0%, a difference of 0.23%).
| Demographics | Rating | Rank | Family Households with Children |
| Immigrants | Sierra Leone | 100.0 /100 | #35 | Exceptional 29.3% |
| Immigrants | Venezuela | 100.0 /100 | #36 | Exceptional 29.3% |
| Immigrants | Cameroon | 100.0 /100 | #37 | Exceptional 29.2% |
| Koreans | 100.0 /100 | #38 | Exceptional 29.2% |
| Yaqui | 100.0 /100 | #39 | Exceptional 29.1% |
| Central Americans | 100.0 /100 | #40 | Exceptional 29.1% |
| Immigrants | South Eastern Asia | 100.0 /100 | #41 | Exceptional 29.1% |
| Spanish American Indians | 100.0 /100 | #42 | Exceptional 29.1% |
| Asians | 100.0 /100 | #43 | Exceptional 29.1% |
| Immigrants | Taiwan | 100.0 /100 | #44 | Exceptional 29.0% |
| Fijians | 100.0 /100 | #45 | Exceptional 29.0% |
| Immigrants | Philippines | 100.0 /100 | #46 | Exceptional 29.0% |
| Peruvians | 100.0 /100 | #47 | Exceptional 29.0% |
| Apache | 100.0 /100 | #48 | Exceptional 29.0% |
| Jordanians | 100.0 /100 | #49 | Exceptional 29.0% |
Demographics Similar to Canadians by Family Households with Children
In terms of family households with children, the demographic groups most similar to Canadians are Czechoslovakian (27.0%, a difference of 0.080%), Tsimshian (27.0%, a difference of 0.080%), Scottish (27.0%, a difference of 0.080%), German (27.1%, a difference of 0.090%), and Immigrants from Caribbean (27.0%, a difference of 0.11%).
| Demographics | Rating | Rank | Family Households with Children |
| Greeks | 11.4 /100 | #218 | Poor 27.1% |
| Immigrants | Japan | 10.7 /100 | #219 | Poor 27.1% |
| Austrians | 9.9 /100 | #220 | Tragic 27.1% |
| New Zealanders | 9.6 /100 | #221 | Tragic 27.1% |
| Paraguayans | 9.4 /100 | #222 | Tragic 27.1% |
| Pima | 9.2 /100 | #223 | Tragic 27.1% |
| Germans | 8.7 /100 | #224 | Tragic 27.1% |
| Canadians | 7.5 /100 | #225 | Tragic 27.1% |
| Czechoslovakians | 6.6 /100 | #226 | Tragic 27.0% |
| Tsimshian | 6.6 /100 | #227 | Tragic 27.0% |
| Scottish | 6.5 /100 | #228 | Tragic 27.0% |
| Immigrants | Caribbean | 6.3 /100 | #229 | Tragic 27.0% |
| Bulgarians | 5.8 /100 | #230 | Tragic 27.0% |
| Luxembourgers | 5.5 /100 | #231 | Tragic 27.0% |
| Yugoslavians | 5.1 /100 | #232 | Tragic 27.0% |