Soviet Union vs Colville Family Households with Children
COMPARE
Soviet Union
Colville
Family Households with Children
Family Households with Children Comparison
Soviet Union
Colville
24.8%
FAMILY HOUSEHOLDS WITH CHILDREN
0.0/ 100
METRIC RATING
347th/ 347
METRIC RANK
26.2%
FAMILY HOUSEHOLDS WITH CHILDREN
0.0/ 100
METRIC RATING
311th/ 347
METRIC RANK
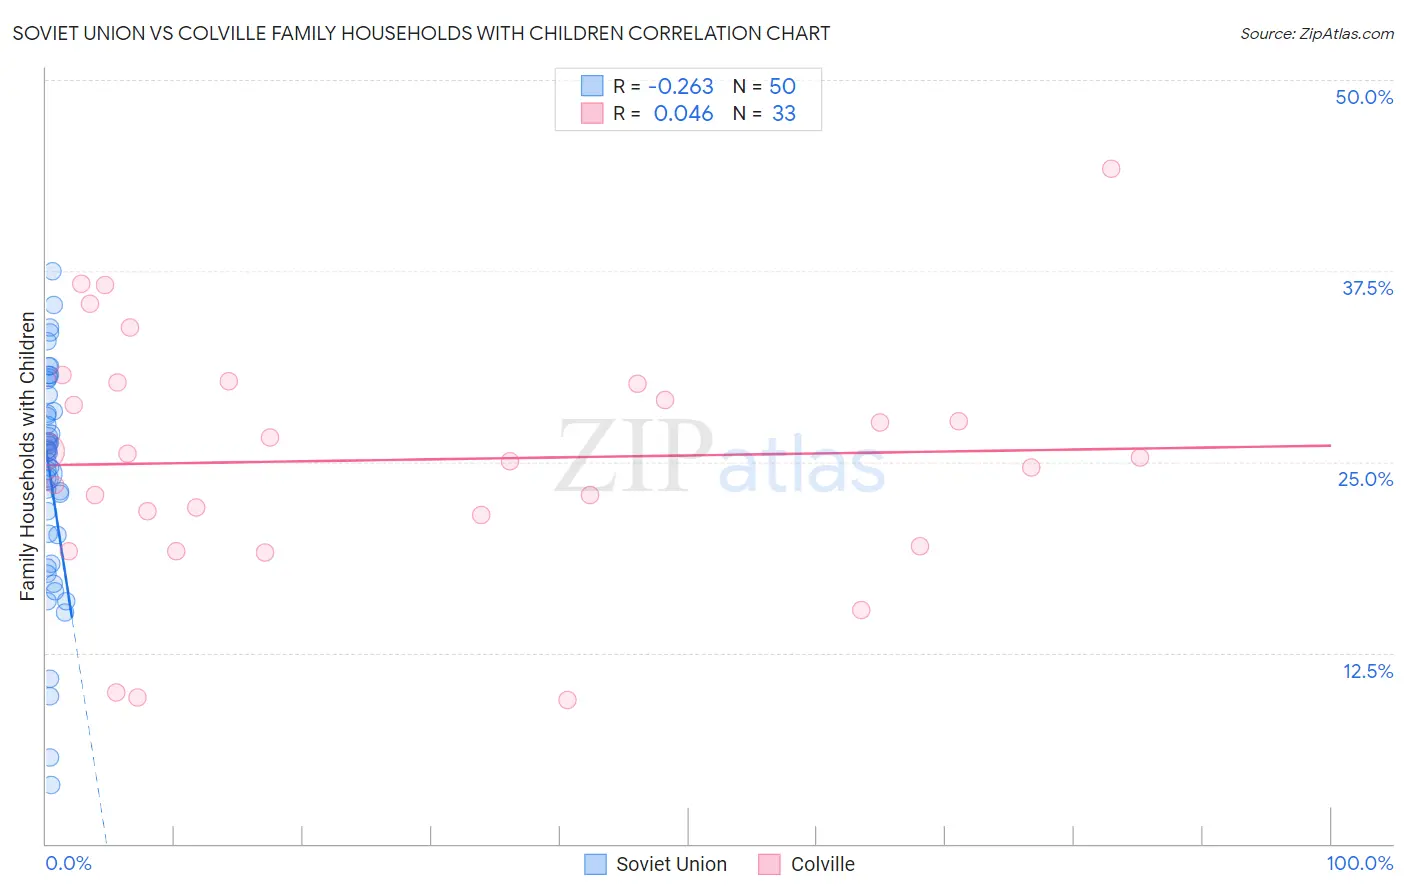
Soviet Union vs Colville Family Households with Children Correlation Chart
The statistical analysis conducted on geographies consisting of 43,507,207 people shows a weak negative correlation between the proportion of Soviet Union and percentage of family households with children in the United States with a correlation coefficient (R) of -0.263 and weighted average of 24.8%. Similarly, the statistical analysis conducted on geographies consisting of 34,682,734 people shows no correlation between the proportion of Colville and percentage of family households with children in the United States with a correlation coefficient (R) of 0.046 and weighted average of 26.2%, a difference of 5.6%.
Family Households with Children Correlation Summary
| Measurement | Soviet Union | Colville |
| Minimum | 3.9% | 9.4% |
| Maximum | 37.4% | 44.2% |
| Range | 33.6% | 34.8% |
| Mean | 24.0% | 25.1% |
| Median | 25.6% | 25.3% |
| Interquartile 25% (IQ1) | 20.2% | 20.5% |
| Interquartile 75% (IQ3) | 28.3% | 30.1% |
| Interquartile Range (IQR) | 8.1% | 9.6% |
| Standard Deviation (Sample) | 7.2% | 7.8% |
| Standard Deviation (Population) | 7.2% | 7.7% |
Similar Demographics by Family Households with Children
Demographics Similar to Soviet Union by Family Households with Children
In terms of family households with children, the demographic groups most similar to Soviet Union are Immigrants from Grenada (25.2%, a difference of 1.3%), Carpatho Rusyn (25.2%, a difference of 1.3%), Pueblo (25.2%, a difference of 1.5%), Hopi (25.2%, a difference of 1.6%), and Alsatian (25.3%, a difference of 1.8%).
| Demographics | Rating | Rank | Family Households with Children |
| Immigrants | Switzerland | 0.0 /100 | #333 | Tragic 25.7% |
| Slovaks | 0.0 /100 | #334 | Tragic 25.7% |
| Immigrants | Croatia | 0.0 /100 | #335 | Tragic 25.7% |
| Immigrants | West Indies | 0.0 /100 | #336 | Tragic 25.7% |
| Puerto Ricans | 0.0 /100 | #337 | Tragic 25.6% |
| Arapaho | 0.0 /100 | #338 | Tragic 25.6% |
| Immigrants | St. Vincent and the Grenadines | 0.0 /100 | #339 | Tragic 25.6% |
| Immigrants | Armenia | 0.0 /100 | #340 | Tragic 25.6% |
| Immigrants | Serbia | 0.0 /100 | #341 | Tragic 25.5% |
| Alsatians | 0.0 /100 | #342 | Tragic 25.3% |
| Hopi | 0.0 /100 | #343 | Tragic 25.2% |
| Pueblo | 0.0 /100 | #344 | Tragic 25.2% |
| Immigrants | Grenada | 0.0 /100 | #345 | Tragic 25.2% |
| Carpatho Rusyns | 0.0 /100 | #346 | Tragic 25.2% |
| Soviet Union | 0.0 /100 | #347 | Tragic 24.8% |
Demographics Similar to Colville by Family Households with Children
In terms of family households with children, the demographic groups most similar to Colville are Marshallese (26.2%, a difference of 0.050%), Immigrants from Czechoslovakia (26.2%, a difference of 0.070%), Immigrants from Somalia (26.3%, a difference of 0.090%), Lumbee (26.3%, a difference of 0.20%), and West Indian (26.3%, a difference of 0.22%).
| Demographics | Rating | Rank | Family Households with Children |
| Immigrants | Bahamas | 0.1 /100 | #304 | Tragic 26.3% |
| Guyanese | 0.1 /100 | #305 | Tragic 26.3% |
| Bermudans | 0.1 /100 | #306 | Tragic 26.3% |
| West Indians | 0.0 /100 | #307 | Tragic 26.3% |
| Lumbee | 0.0 /100 | #308 | Tragic 26.3% |
| Immigrants | Somalia | 0.0 /100 | #309 | Tragic 26.3% |
| Marshallese | 0.0 /100 | #310 | Tragic 26.2% |
| Colville | 0.0 /100 | #311 | Tragic 26.2% |
| Immigrants | Czechoslovakia | 0.0 /100 | #312 | Tragic 26.2% |
| Cree | 0.0 /100 | #313 | Tragic 26.2% |
| French Canadians | 0.0 /100 | #314 | Tragic 26.1% |
| Immigrants | Norway | 0.0 /100 | #315 | Tragic 26.1% |
| Estonians | 0.0 /100 | #316 | Tragic 26.1% |
| Ottawa | 0.0 /100 | #317 | Tragic 26.1% |
| Iroquois | 0.0 /100 | #318 | Tragic 26.1% |