Slovene vs Colville Family Households with Children
COMPARE
Slovene
Colville
Family Households with Children
Family Households with Children Comparison
Slovenes
Colville
25.8%
FAMILY HOUSEHOLDS WITH CHILDREN
0.0/ 100
METRIC RATING
331st/ 347
METRIC RANK
26.2%
FAMILY HOUSEHOLDS WITH CHILDREN
0.0/ 100
METRIC RATING
311th/ 347
METRIC RANK
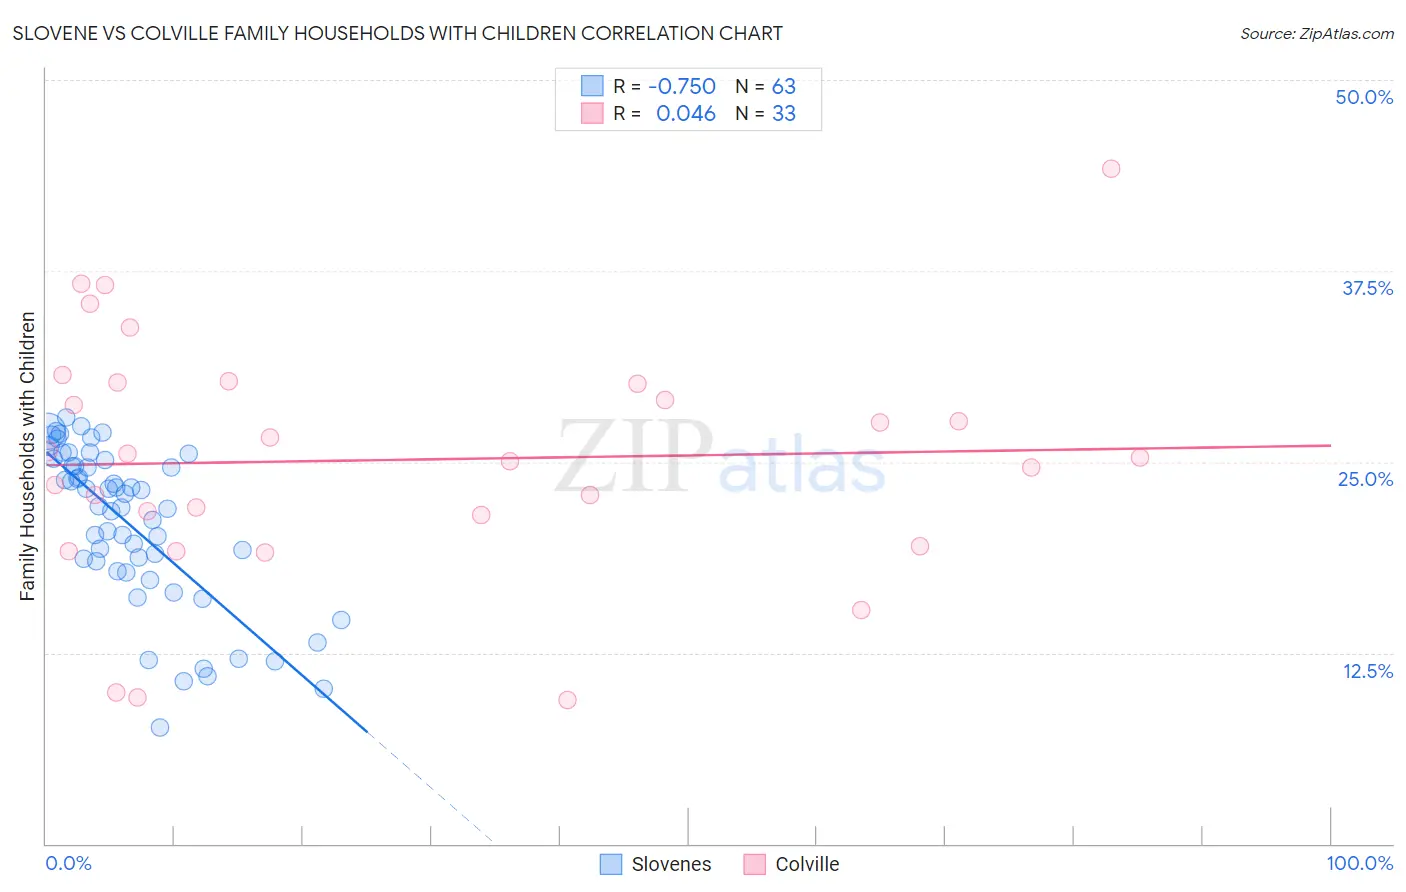
Slovene vs Colville Family Households with Children Correlation Chart
The statistical analysis conducted on geographies consisting of 261,178,360 people shows a strong negative correlation between the proportion of Slovenes and percentage of family households with children in the United States with a correlation coefficient (R) of -0.750 and weighted average of 25.8%. Similarly, the statistical analysis conducted on geographies consisting of 34,682,734 people shows no correlation between the proportion of Colville and percentage of family households with children in the United States with a correlation coefficient (R) of 0.046 and weighted average of 26.2%, a difference of 1.6%.
Family Households with Children Correlation Summary
| Measurement | Slovene | Colville |
| Minimum | 7.6% | 9.4% |
| Maximum | 27.9% | 44.2% |
| Range | 20.3% | 34.8% |
| Mean | 20.9% | 25.1% |
| Median | 22.1% | 25.3% |
| Interquartile 25% (IQ1) | 17.8% | 20.5% |
| Interquartile 75% (IQ3) | 25.2% | 30.1% |
| Interquartile Range (IQR) | 7.4% | 9.6% |
| Standard Deviation (Sample) | 5.2% | 7.8% |
| Standard Deviation (Population) | 5.1% | 7.7% |
Demographics Similar to Slovenes and Colville by Family Households with Children
In terms of family households with children, the demographic groups most similar to Slovenes are Immigrants from Latvia (25.9%, a difference of 0.13%), Cypriot (25.9%, a difference of 0.31%), Immigrants from Albania (25.9%, a difference of 0.44%), Immigrants from Barbados (26.0%, a difference of 0.54%), and Immigrants from Ireland (26.0%, a difference of 0.65%). Similarly, the demographic groups most similar to Colville are Immigrants from Czechoslovakia (26.2%, a difference of 0.070%), Cree (26.2%, a difference of 0.32%), French Canadian (26.1%, a difference of 0.40%), Immigrants from Norway (26.1%, a difference of 0.48%), and Estonian (26.1%, a difference of 0.56%).
| Demographics | Rating | Rank | Family Households with Children |
| Colville | 0.0 /100 | #311 | Tragic 26.2% |
| Immigrants | Czechoslovakia | 0.0 /100 | #312 | Tragic 26.2% |
| Cree | 0.0 /100 | #313 | Tragic 26.2% |
| French Canadians | 0.0 /100 | #314 | Tragic 26.1% |
| Immigrants | Norway | 0.0 /100 | #315 | Tragic 26.1% |
| Estonians | 0.0 /100 | #316 | Tragic 26.1% |
| Ottawa | 0.0 /100 | #317 | Tragic 26.1% |
| Iroquois | 0.0 /100 | #318 | Tragic 26.1% |
| Immigrants | France | 0.0 /100 | #319 | Tragic 26.0% |
| Tlingit-Haida | 0.0 /100 | #320 | Tragic 26.0% |
| British West Indians | 0.0 /100 | #321 | Tragic 26.0% |
| Immigrants | Greece | 0.0 /100 | #322 | Tragic 26.0% |
| Immigrants | Australia | 0.0 /100 | #323 | Tragic 26.0% |
| Chinese | 0.0 /100 | #324 | Tragic 26.0% |
| Barbadians | 0.0 /100 | #325 | Tragic 26.0% |
| Immigrants | Ireland | 0.0 /100 | #326 | Tragic 26.0% |
| Immigrants | Barbados | 0.0 /100 | #327 | Tragic 26.0% |
| Immigrants | Albania | 0.0 /100 | #328 | Tragic 25.9% |
| Cypriots | 0.0 /100 | #329 | Tragic 25.9% |
| Immigrants | Latvia | 0.0 /100 | #330 | Tragic 25.9% |
| Slovenes | 0.0 /100 | #331 | Tragic 25.8% |