South American Indian vs Samoan Currently Married
COMPARE
South American Indian
Samoan
Currently Married
Currently Married Comparison
South American Indians
Samoans
45.8%
CURRENTLY MARRIED
11.5/ 100
METRIC RATING
205th/ 347
METRIC RANK
46.8%
CURRENTLY MARRIED
59.8/ 100
METRIC RATING
165th/ 347
METRIC RANK
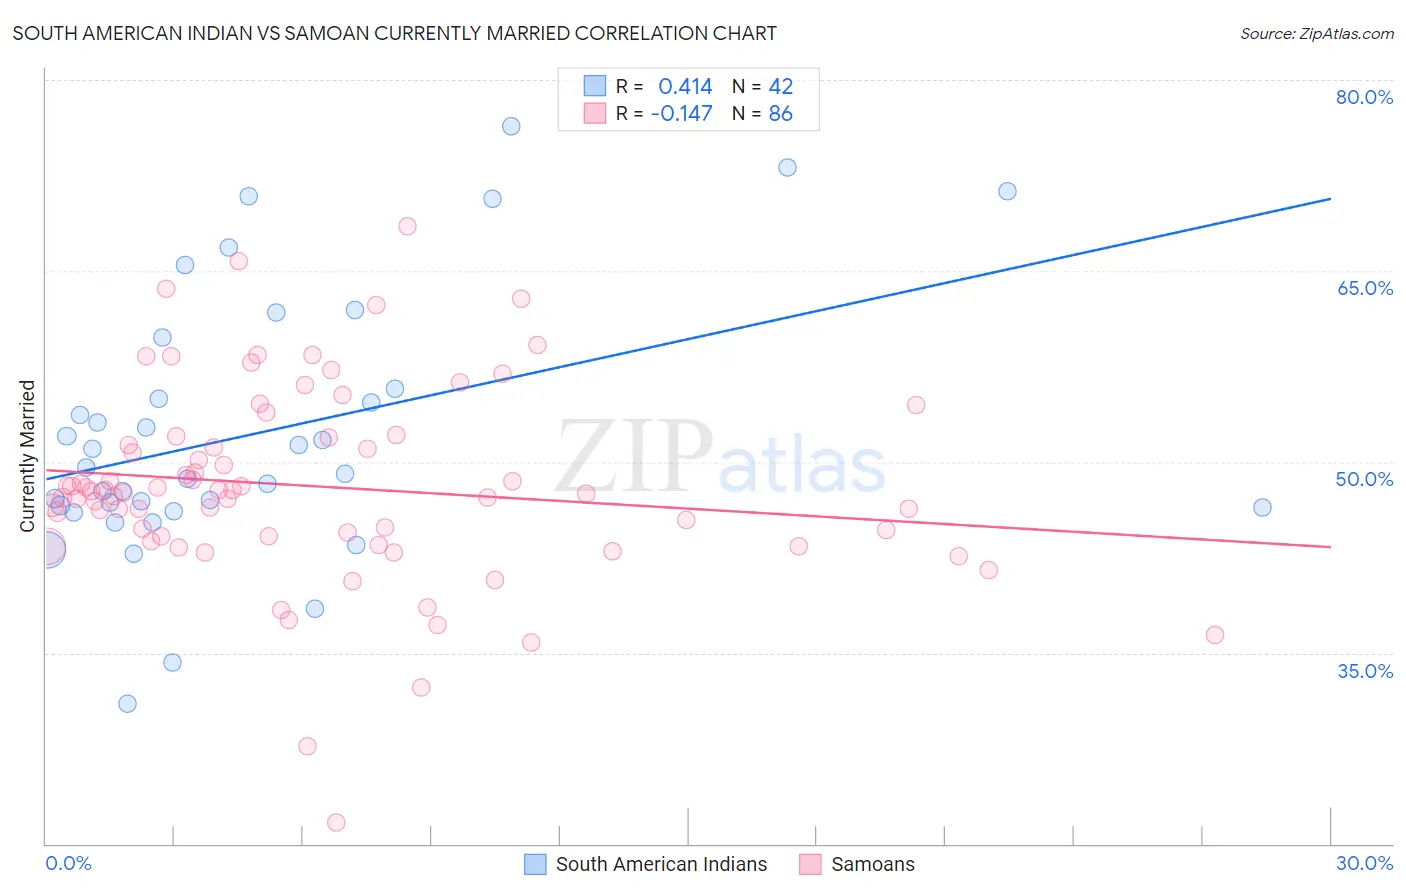
South American Indian vs Samoan Currently Married Correlation Chart
The statistical analysis conducted on geographies consisting of 164,571,412 people shows a moderate positive correlation between the proportion of South American Indians and percentage of population currently married in the United States with a correlation coefficient (R) of 0.414 and weighted average of 45.8%. Similarly, the statistical analysis conducted on geographies consisting of 225,188,155 people shows a poor negative correlation between the proportion of Samoans and percentage of population currently married in the United States with a correlation coefficient (R) of -0.147 and weighted average of 46.8%, a difference of 2.3%.
Currently Married Correlation Summary
| Measurement | South American Indian | Samoan |
| Minimum | 31.0% | 21.7% |
| Maximum | 76.4% | 68.5% |
| Range | 45.4% | 46.8% |
| Mean | 52.3% | 48.1% |
| Median | 49.3% | 47.6% |
| Interquartile 25% (IQ1) | 46.4% | 44.1% |
| Interquartile 75% (IQ3) | 55.7% | 51.9% |
| Interquartile Range (IQR) | 9.3% | 7.8% |
| Standard Deviation (Sample) | 10.3% | 7.8% |
| Standard Deviation (Population) | 10.2% | 7.7% |
Similar Demographics by Currently Married
Demographics Similar to South American Indians by Currently Married
In terms of currently married, the demographic groups most similar to South American Indians are Taiwanese (45.8%, a difference of 0.020%), Immigrants from Spain (45.8%, a difference of 0.020%), Immigrants (45.8%, a difference of 0.020%), Immigrants from South America (45.7%, a difference of 0.060%), and Alsatian (45.7%, a difference of 0.070%).
| Demographics | Rating | Rank | Currently Married |
| Immigrants | Colombia | 21.0 /100 | #198 | Fair 46.1% |
| Immigrants | Costa Rica | 19.6 /100 | #199 | Poor 46.0% |
| Creek | 17.2 /100 | #200 | Poor 46.0% |
| Malaysians | 15.3 /100 | #201 | Poor 45.9% |
| Immigrants | Albania | 14.5 /100 | #202 | Poor 45.9% |
| Taiwanese | 11.7 /100 | #203 | Poor 45.8% |
| Immigrants | Spain | 11.6 /100 | #204 | Poor 45.8% |
| South American Indians | 11.5 /100 | #205 | Poor 45.8% |
| Immigrants | Immigrants | 11.2 /100 | #206 | Poor 45.8% |
| Immigrants | South America | 10.8 /100 | #207 | Poor 45.7% |
| Alsatians | 10.8 /100 | #208 | Poor 45.7% |
| Immigrants | Micronesia | 8.8 /100 | #209 | Tragic 45.6% |
| Uruguayans | 7.9 /100 | #210 | Tragic 45.6% |
| Houma | 7.2 /100 | #211 | Tragic 45.5% |
| Marshallese | 7.2 /100 | #212 | Tragic 45.5% |
Demographics Similar to Samoans by Currently Married
In terms of currently married, the demographic groups most similar to Samoans are Immigrants from Syria (46.8%, a difference of 0.020%), Spaniard (46.8%, a difference of 0.040%), Immigrants from Afghanistan (46.8%, a difference of 0.060%), Armenian (46.8%, a difference of 0.060%), and Immigrants from Latvia (46.7%, a difference of 0.11%).
| Demographics | Rating | Rank | Currently Married |
| Cherokee | 66.8 /100 | #158 | Good 46.9% |
| Iraqis | 66.4 /100 | #159 | Good 46.9% |
| Immigrants | Uzbekistan | 66.0 /100 | #160 | Good 46.9% |
| Immigrants | Southern Europe | 65.9 /100 | #161 | Good 46.9% |
| Immigrants | Nonimmigrants | 65.4 /100 | #162 | Good 46.9% |
| Delaware | 64.7 /100 | #163 | Good 46.9% |
| Immigrants | Western Asia | 64.2 /100 | #164 | Good 46.9% |
| Samoans | 59.8 /100 | #165 | Average 46.8% |
| Immigrants | Syria | 59.3 /100 | #166 | Average 46.8% |
| Spaniards | 58.8 /100 | #167 | Average 46.8% |
| Immigrants | Afghanistan | 58.2 /100 | #168 | Average 46.8% |
| Armenians | 58.2 /100 | #169 | Average 46.8% |
| Immigrants | Latvia | 56.7 /100 | #170 | Average 46.7% |
| Immigrants | Zimbabwe | 52.4 /100 | #171 | Average 46.7% |
| Aleuts | 52.0 /100 | #172 | Average 46.7% |