Pakistani vs Samoan Currently Married
COMPARE
Pakistani
Samoan
Currently Married
Currently Married Comparison
Pakistanis
Samoans
47.2%
CURRENTLY MARRIED
77.5/ 100
METRIC RATING
138th/ 347
METRIC RANK
46.8%
CURRENTLY MARRIED
59.8/ 100
METRIC RATING
165th/ 347
METRIC RANK
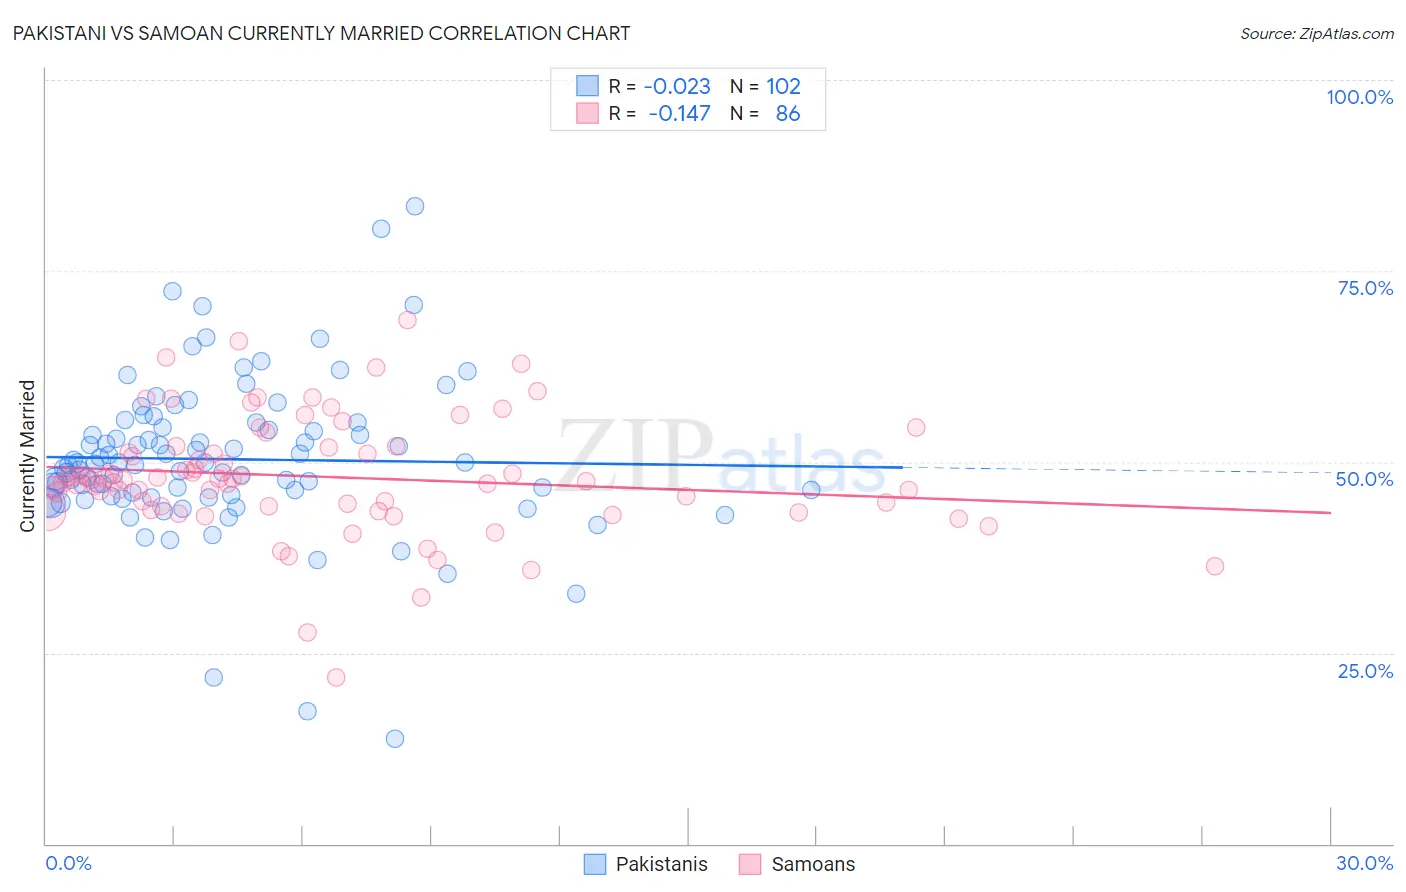
Pakistani vs Samoan Currently Married Correlation Chart
The statistical analysis conducted on geographies consisting of 335,346,358 people shows no correlation between the proportion of Pakistanis and percentage of population currently married in the United States with a correlation coefficient (R) of -0.023 and weighted average of 47.2%. Similarly, the statistical analysis conducted on geographies consisting of 225,188,155 people shows a poor negative correlation between the proportion of Samoans and percentage of population currently married in the United States with a correlation coefficient (R) of -0.147 and weighted average of 46.8%, a difference of 0.76%.
Currently Married Correlation Summary
| Measurement | Pakistani | Samoan |
| Minimum | 13.7% | 21.7% |
| Maximum | 83.4% | 68.5% |
| Range | 69.7% | 46.8% |
| Mean | 50.3% | 48.1% |
| Median | 49.7% | 47.6% |
| Interquartile 25% (IQ1) | 45.4% | 44.1% |
| Interquartile 75% (IQ3) | 54.5% | 51.9% |
| Interquartile Range (IQR) | 9.1% | 7.8% |
| Standard Deviation (Sample) | 10.3% | 7.8% |
| Standard Deviation (Population) | 10.3% | 7.7% |
Similar Demographics by Currently Married
Demographics Similar to Pakistanis by Currently Married
In terms of currently married, the demographic groups most similar to Pakistanis are Yugoslavian (47.2%, a difference of 0.0%), Paraguayan (47.2%, a difference of 0.020%), Immigrants from Vietnam (47.2%, a difference of 0.040%), Cajun (47.1%, a difference of 0.11%), and Immigrants from Norway (47.2%, a difference of 0.12%).
| Demographics | Rating | Rank | Currently Married |
| Icelanders | 82.4 /100 | #131 | Excellent 47.3% |
| Afghans | 81.8 /100 | #132 | Excellent 47.3% |
| Immigrants | Malaysia | 81.1 /100 | #133 | Excellent 47.3% |
| Immigrants | Australia | 81.1 /100 | #134 | Excellent 47.3% |
| Immigrants | Norway | 79.7 /100 | #135 | Good 47.2% |
| Immigrants | Vietnam | 78.2 /100 | #136 | Good 47.2% |
| Paraguayans | 77.8 /100 | #137 | Good 47.2% |
| Pakistanis | 77.5 /100 | #138 | Good 47.2% |
| Yugoslavians | 77.4 /100 | #139 | Good 47.2% |
| Cajuns | 75.3 /100 | #140 | Good 47.1% |
| Venezuelans | 74.4 /100 | #141 | Good 47.1% |
| Argentineans | 74.4 /100 | #142 | Good 47.1% |
| Guamanians/Chamorros | 74.2 /100 | #143 | Good 47.1% |
| Hmong | 73.4 /100 | #144 | Good 47.1% |
| Immigrants | South Eastern Asia | 72.9 /100 | #145 | Good 47.1% |
Demographics Similar to Samoans by Currently Married
In terms of currently married, the demographic groups most similar to Samoans are Immigrants from Syria (46.8%, a difference of 0.020%), Spaniard (46.8%, a difference of 0.040%), Immigrants from Afghanistan (46.8%, a difference of 0.060%), Armenian (46.8%, a difference of 0.060%), and Immigrants from Latvia (46.7%, a difference of 0.11%).
| Demographics | Rating | Rank | Currently Married |
| Cherokee | 66.8 /100 | #158 | Good 46.9% |
| Iraqis | 66.4 /100 | #159 | Good 46.9% |
| Immigrants | Uzbekistan | 66.0 /100 | #160 | Good 46.9% |
| Immigrants | Southern Europe | 65.9 /100 | #161 | Good 46.9% |
| Immigrants | Nonimmigrants | 65.4 /100 | #162 | Good 46.9% |
| Delaware | 64.7 /100 | #163 | Good 46.9% |
| Immigrants | Western Asia | 64.2 /100 | #164 | Good 46.9% |
| Samoans | 59.8 /100 | #165 | Average 46.8% |
| Immigrants | Syria | 59.3 /100 | #166 | Average 46.8% |
| Spaniards | 58.8 /100 | #167 | Average 46.8% |
| Immigrants | Afghanistan | 58.2 /100 | #168 | Average 46.8% |
| Armenians | 58.2 /100 | #169 | Average 46.8% |
| Immigrants | Latvia | 56.7 /100 | #170 | Average 46.7% |
| Immigrants | Zimbabwe | 52.4 /100 | #171 | Average 46.7% |
| Aleuts | 52.0 /100 | #172 | Average 46.7% |