South American Indian vs Bolivian Family Households
COMPARE
South American Indian
Bolivian
Family Households
Family Households Comparison
South American Indians
Bolivians
64.6%
FAMILY HOUSEHOLDS
81.9/ 100
METRIC RATING
144th/ 347
METRIC RANK
66.5%
FAMILY HOUSEHOLDS
100.0/ 100
METRIC RATING
47th/ 347
METRIC RANK
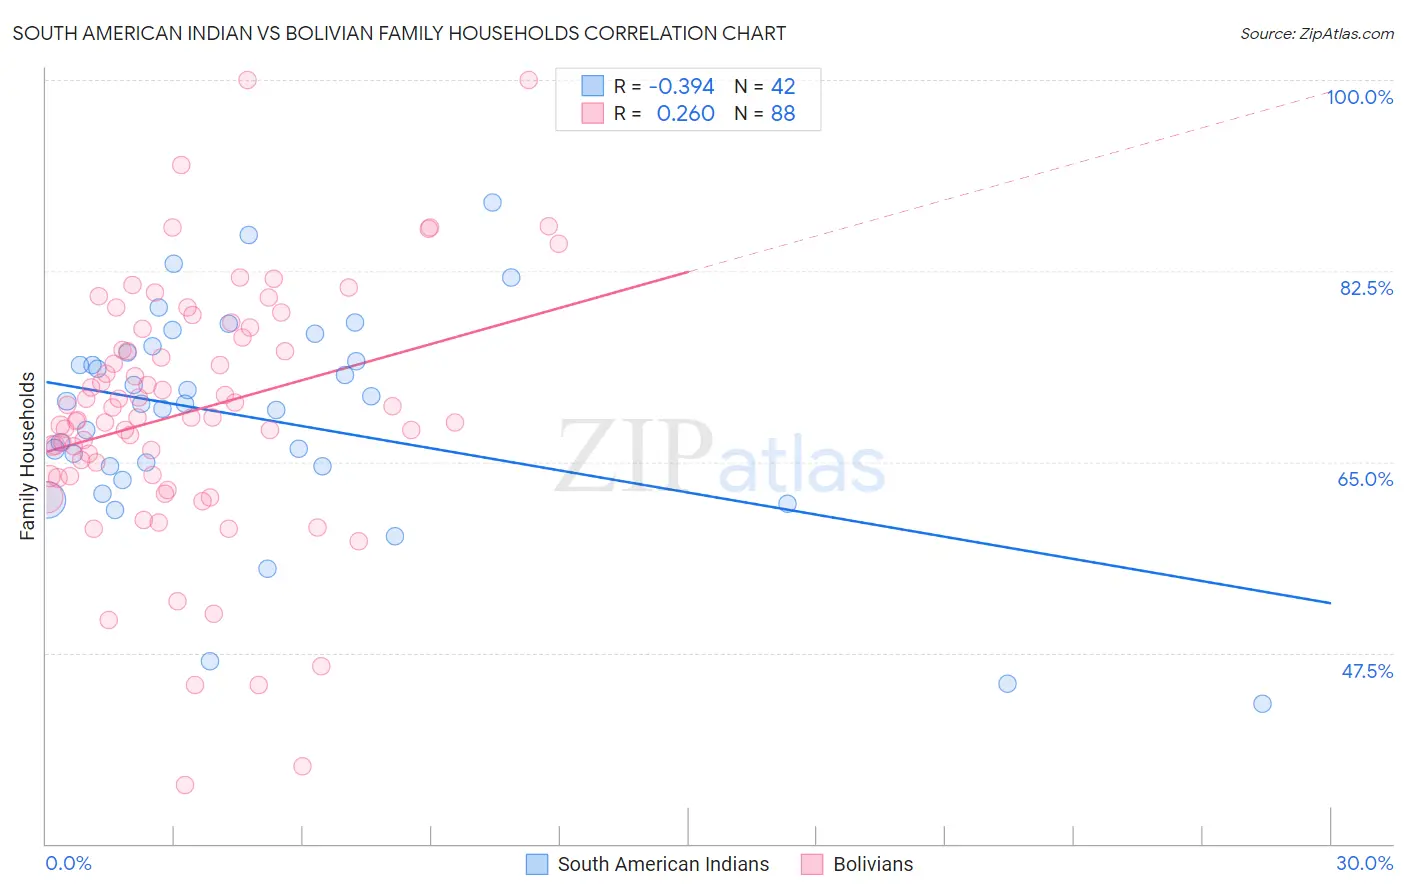
South American Indian vs Bolivian Family Households Correlation Chart
The statistical analysis conducted on geographies consisting of 164,540,449 people shows a mild negative correlation between the proportion of South American Indians and percentage of family households in the United States with a correlation coefficient (R) of -0.394 and weighted average of 64.6%. Similarly, the statistical analysis conducted on geographies consisting of 184,628,552 people shows a weak positive correlation between the proportion of Bolivians and percentage of family households in the United States with a correlation coefficient (R) of 0.260 and weighted average of 66.5%, a difference of 2.8%.
Family Households Correlation Summary
| Measurement | South American Indian | Bolivian |
| Minimum | 42.9% | 35.4% |
| Maximum | 88.8% | 100.0% |
| Range | 45.9% | 64.6% |
| Mean | 69.0% | 69.6% |
| Median | 70.3% | 69.1% |
| Interquartile 25% (IQ1) | 64.6% | 63.8% |
| Interquartile 75% (IQ3) | 75.0% | 76.8% |
| Interquartile Range (IQR) | 10.5% | 13.1% |
| Standard Deviation (Sample) | 10.0% | 11.6% |
| Standard Deviation (Population) | 9.9% | 11.5% |
Similar Demographics by Family Households
Demographics Similar to South American Indians by Family Households
In terms of family households, the demographic groups most similar to South American Indians are Czechoslovakian (64.6%, a difference of 0.0%), Welsh (64.6%, a difference of 0.040%), Pakistani (64.7%, a difference of 0.050%), Immigrants from North Macedonia (64.7%, a difference of 0.070%), and Immigrants from Cameroon (64.7%, a difference of 0.070%).
| Demographics | Rating | Rank | Family Households |
| Immigrants | Scotland | 86.4 /100 | #137 | Excellent 64.7% |
| Basques | 85.5 /100 | #138 | Excellent 64.7% |
| Immigrants | Jamaica | 85.3 /100 | #139 | Excellent 64.7% |
| Immigrants | North Macedonia | 84.9 /100 | #140 | Excellent 64.7% |
| Immigrants | Cameroon | 84.8 /100 | #141 | Excellent 64.7% |
| Pakistanis | 84.0 /100 | #142 | Excellent 64.7% |
| Czechoslovakians | 82.1 /100 | #143 | Excellent 64.6% |
| South American Indians | 81.9 /100 | #144 | Excellent 64.6% |
| Welsh | 80.1 /100 | #145 | Excellent 64.6% |
| Immigrants | Romania | 77.0 /100 | #146 | Good 64.6% |
| Immigrants | Chile | 76.5 /100 | #147 | Good 64.6% |
| Delaware | 76.3 /100 | #148 | Good 64.6% |
| Sioux | 76.3 /100 | #149 | Good 64.6% |
| Romanians | 75.3 /100 | #150 | Good 64.5% |
| Syrians | 75.2 /100 | #151 | Good 64.5% |
Demographics Similar to Bolivians by Family Households
In terms of family households, the demographic groups most similar to Bolivians are Immigrants from Venezuela (66.4%, a difference of 0.020%), Arapaho (66.5%, a difference of 0.030%), Venezuelan (66.5%, a difference of 0.050%), Asian (66.5%, a difference of 0.070%), and Immigrants from South Central Asia (66.4%, a difference of 0.070%).
| Demographics | Rating | Rank | Family Households |
| Guamanians/Chamorros | 100.0 /100 | #40 | Exceptional 66.6% |
| Immigrants | Bolivia | 100.0 /100 | #41 | Exceptional 66.6% |
| Menominee | 100.0 /100 | #42 | Exceptional 66.5% |
| Apache | 100.0 /100 | #43 | Exceptional 66.5% |
| Asians | 100.0 /100 | #44 | Exceptional 66.5% |
| Venezuelans | 100.0 /100 | #45 | Exceptional 66.5% |
| Arapaho | 100.0 /100 | #46 | Exceptional 66.5% |
| Bolivians | 100.0 /100 | #47 | Exceptional 66.5% |
| Immigrants | Venezuela | 100.0 /100 | #48 | Exceptional 66.4% |
| Immigrants | South Central Asia | 100.0 /100 | #49 | Exceptional 66.4% |
| Navajo | 100.0 /100 | #50 | Exceptional 66.4% |
| Natives/Alaskans | 100.0 /100 | #51 | Exceptional 66.4% |
| Colombians | 100.0 /100 | #52 | Exceptional 66.3% |
| Afghans | 100.0 /100 | #53 | Exceptional 66.3% |
| Immigrants | Colombia | 100.0 /100 | #54 | Exceptional 66.3% |