Slavic vs Immigrants from South Central Asia Single Father Households
COMPARE
Slavic
Immigrants from South Central Asia
Single Father Households
Single Father Households Comparison
Slavs
Immigrants from South Central Asia
2.2%
SINGLE FATHER HOUSEHOLDS
88.9/ 100
METRIC RATING
147th/ 347
METRIC RANK
2.0%
SINGLE FATHER HOUSEHOLDS
100.0/ 100
METRIC RATING
27th/ 347
METRIC RANK
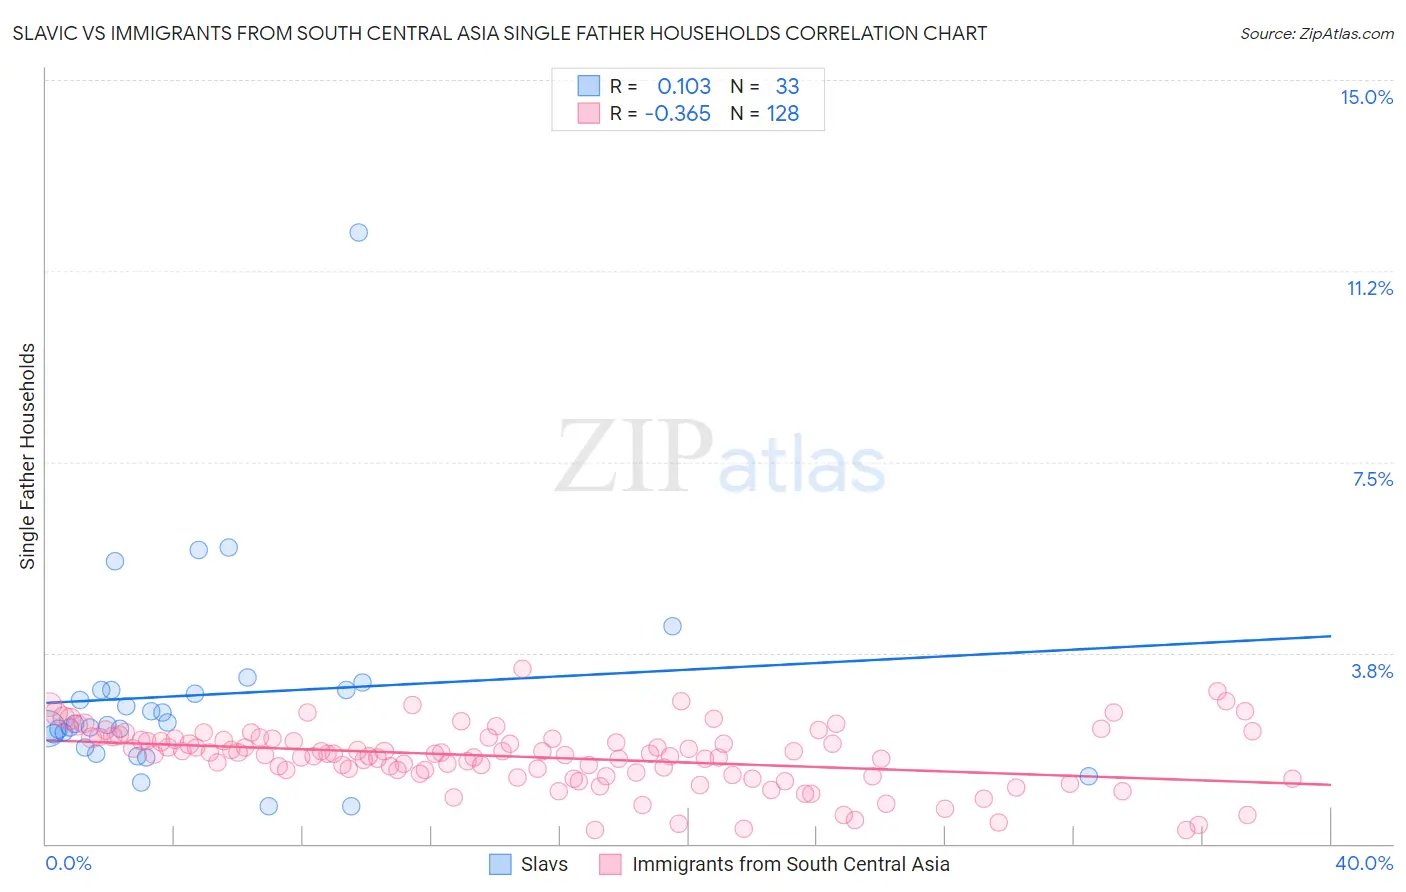
Slavic vs Immigrants from South Central Asia Single Father Households Correlation Chart
The statistical analysis conducted on geographies consisting of 269,247,483 people shows a poor positive correlation between the proportion of Slavs and percentage of single father households in the United States with a correlation coefficient (R) of 0.103 and weighted average of 2.2%. Similarly, the statistical analysis conducted on geographies consisting of 467,429,845 people shows a mild negative correlation between the proportion of Immigrants from South Central Asia and percentage of single father households in the United States with a correlation coefficient (R) of -0.365 and weighted average of 2.0%, a difference of 14.4%.
Single Father Households Correlation Summary
| Measurement | Slavic | Immigrants from South Central Asia |
| Minimum | 0.74% | 0.26% |
| Maximum | 12.0% | 3.4% |
| Range | 11.3% | 3.2% |
| Mean | 2.9% | 1.7% |
| Median | 2.4% | 1.8% |
| Interquartile 25% (IQ1) | 2.0% | 1.4% |
| Interquartile 75% (IQ3) | 3.0% | 2.1% |
| Interquartile Range (IQR) | 1.0% | 0.70% |
| Standard Deviation (Sample) | 2.0% | 0.60% |
| Standard Deviation (Population) | 2.0% | 0.60% |
Similar Demographics by Single Father Households
Demographics Similar to Slavs by Single Father Households
In terms of single father households, the demographic groups most similar to Slavs are South American Indian (2.3%, a difference of 0.090%), Senegalese (2.3%, a difference of 0.10%), Northern European (2.2%, a difference of 0.18%), Immigrants from Zimbabwe (2.2%, a difference of 0.26%), and Slovak (2.2%, a difference of 0.37%).
| Demographics | Rating | Rank | Single Father Households |
| British | 92.8 /100 | #140 | Exceptional 2.2% |
| Laotians | 92.5 /100 | #141 | Exceptional 2.2% |
| Luxembourgers | 92.3 /100 | #142 | Exceptional 2.2% |
| Immigrants | Nepal | 92.1 /100 | #143 | Exceptional 2.2% |
| Slovaks | 90.7 /100 | #144 | Exceptional 2.2% |
| Immigrants | Zimbabwe | 90.2 /100 | #145 | Exceptional 2.2% |
| Northern Europeans | 89.8 /100 | #146 | Excellent 2.2% |
| Slavs | 88.9 /100 | #147 | Excellent 2.2% |
| South American Indians | 88.5 /100 | #148 | Excellent 2.3% |
| Senegalese | 88.4 /100 | #149 | Excellent 2.3% |
| Venezuelans | 86.2 /100 | #150 | Excellent 2.3% |
| Immigrants | Syria | 84.8 /100 | #151 | Excellent 2.3% |
| Immigrants | Venezuela | 83.2 /100 | #152 | Excellent 2.3% |
| Immigrants | Germany | 82.8 /100 | #153 | Excellent 2.3% |
| Bolivians | 81.0 /100 | #154 | Excellent 2.3% |
Demographics Similar to Immigrants from South Central Asia by Single Father Households
In terms of single father households, the demographic groups most similar to Immigrants from South Central Asia are Immigrants from Japan (2.0%, a difference of 0.18%), Bulgarian (2.0%, a difference of 0.27%), Assyrian/Chaldean/Syriac (2.0%, a difference of 0.28%), Cambodian (2.0%, a difference of 0.29%), and Israeli (2.0%, a difference of 0.32%).
| Demographics | Rating | Rank | Single Father Households |
| Thais | 100.0 /100 | #20 | Exceptional 1.9% |
| Immigrants | Albania | 100.0 /100 | #21 | Exceptional 1.9% |
| Immigrants | Latvia | 100.0 /100 | #22 | Exceptional 1.9% |
| Immigrants | Croatia | 100.0 /100 | #23 | Exceptional 2.0% |
| Immigrants | Russia | 100.0 /100 | #24 | Exceptional 2.0% |
| Eastern Europeans | 100.0 /100 | #25 | Exceptional 2.0% |
| Assyrians/Chaldeans/Syriacs | 100.0 /100 | #26 | Exceptional 2.0% |
| Immigrants | South Central Asia | 100.0 /100 | #27 | Exceptional 2.0% |
| Immigrants | Japan | 100.0 /100 | #28 | Exceptional 2.0% |
| Bulgarians | 100.0 /100 | #29 | Exceptional 2.0% |
| Cambodians | 100.0 /100 | #30 | Exceptional 2.0% |
| Israelis | 100.0 /100 | #31 | Exceptional 2.0% |
| Chinese | 100.0 /100 | #32 | Exceptional 2.0% |
| Turks | 100.0 /100 | #33 | Exceptional 2.0% |
| Immigrants | Australia | 100.0 /100 | #34 | Exceptional 2.0% |