Panamanian vs Immigrants from Bahamas Single Father Households
COMPARE
Panamanian
Immigrants from Bahamas
Single Father Households
Single Father Households Comparison
Panamanians
Immigrants from Bahamas
2.4%
SINGLE FATHER HOUSEHOLDS
29.6/ 100
METRIC RATING
194th/ 347
METRIC RANK
2.4%
SINGLE FATHER HOUSEHOLDS
10.6/ 100
METRIC RATING
224th/ 347
METRIC RANK
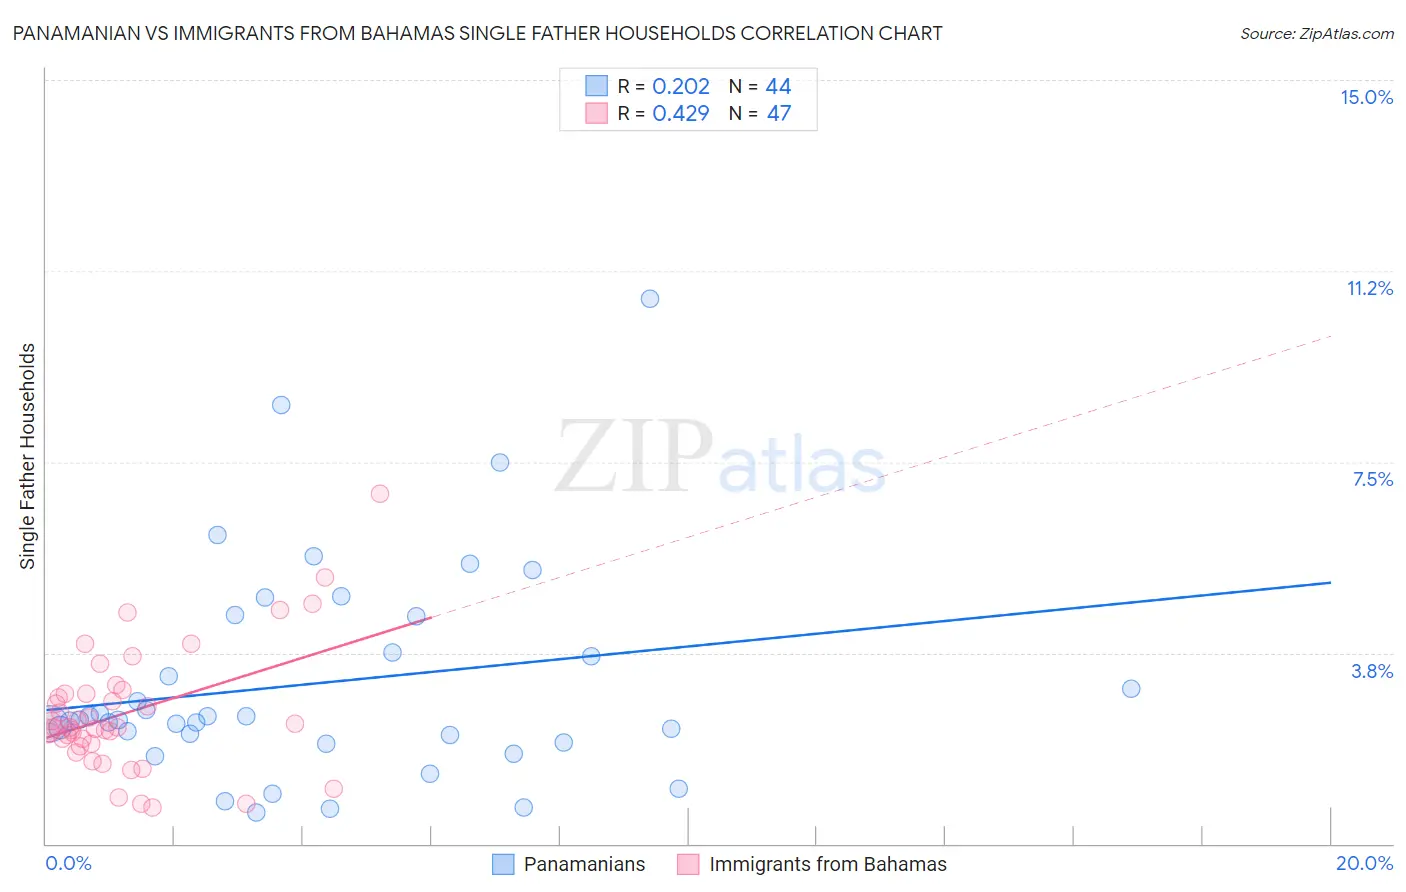
Panamanian vs Immigrants from Bahamas Single Father Households Correlation Chart
The statistical analysis conducted on geographies consisting of 279,967,091 people shows a weak positive correlation between the proportion of Panamanians and percentage of single father households in the United States with a correlation coefficient (R) of 0.202 and weighted average of 2.4%. Similarly, the statistical analysis conducted on geographies consisting of 104,421,589 people shows a moderate positive correlation between the proportion of Immigrants from Bahamas and percentage of single father households in the United States with a correlation coefficient (R) of 0.429 and weighted average of 2.4%, a difference of 2.3%.
Single Father Households Correlation Summary
| Measurement | Panamanian | Immigrants from Bahamas |
| Minimum | 0.62% | 0.71% |
| Maximum | 10.7% | 6.9% |
| Range | 10.1% | 6.2% |
| Mean | 3.2% | 2.6% |
| Median | 2.4% | 2.3% |
| Interquartile 25% (IQ1) | 2.1% | 2.0% |
| Interquartile 75% (IQ3) | 4.1% | 3.0% |
| Interquartile Range (IQR) | 2.1% | 0.97% |
| Standard Deviation (Sample) | 2.1% | 1.2% |
| Standard Deviation (Population) | 2.1% | 1.2% |
Similar Demographics by Single Father Households
Demographics Similar to Panamanians by Single Father Households
In terms of single father households, the demographic groups most similar to Panamanians are Uruguayan (2.4%, a difference of 0.010%), Immigrants from Sudan (2.4%, a difference of 0.020%), Immigrants from Africa (2.4%, a difference of 0.030%), Immigrants from Philippines (2.4%, a difference of 0.080%), and Kenyan (2.4%, a difference of 0.14%).
| Demographics | Rating | Rank | Single Father Households |
| Immigrants | Colombia | 34.0 /100 | #187 | Fair 2.4% |
| Hmong | 33.0 /100 | #188 | Fair 2.4% |
| U.S. Virgin Islanders | 31.8 /100 | #189 | Fair 2.4% |
| French | 31.7 /100 | #190 | Fair 2.4% |
| Immigrants | Africa | 30.0 /100 | #191 | Fair 2.4% |
| Immigrants | Sudan | 29.8 /100 | #192 | Fair 2.4% |
| Uruguayans | 29.7 /100 | #193 | Fair 2.4% |
| Panamanians | 29.6 /100 | #194 | Fair 2.4% |
| Immigrants | Philippines | 28.7 /100 | #195 | Fair 2.4% |
| Kenyans | 28.0 /100 | #196 | Fair 2.4% |
| Germans | 28.0 /100 | #197 | Fair 2.4% |
| Scandinavians | 27.4 /100 | #198 | Fair 2.4% |
| Immigrants | Vietnam | 27.1 /100 | #199 | Fair 2.4% |
| Peruvians | 27.1 /100 | #200 | Fair 2.4% |
| Immigrants | Uganda | 26.0 /100 | #201 | Fair 2.4% |
Demographics Similar to Immigrants from Bahamas by Single Father Households
In terms of single father households, the demographic groups most similar to Immigrants from Bahamas are Immigrants from Uruguay (2.4%, a difference of 0.070%), Marshallese (2.4%, a difference of 0.17%), Black/African American (2.4%, a difference of 0.19%), Immigrants from Eastern Africa (2.4%, a difference of 0.23%), and American (2.4%, a difference of 0.25%).
| Demographics | Rating | Rank | Single Father Households |
| Dutch | 14.3 /100 | #217 | Poor 2.4% |
| Immigrants | Ethiopia | 13.4 /100 | #218 | Poor 2.4% |
| Sudanese | 13.0 /100 | #219 | Poor 2.4% |
| Ghanaians | 12.9 /100 | #220 | Poor 2.4% |
| Immigrants | Burma/Myanmar | 12.1 /100 | #221 | Poor 2.4% |
| Immigrants | Eastern Africa | 11.9 /100 | #222 | Poor 2.4% |
| Immigrants | Uruguay | 11.0 /100 | #223 | Poor 2.4% |
| Immigrants | Bahamas | 10.6 /100 | #224 | Poor 2.4% |
| Marshallese | 9.7 /100 | #225 | Tragic 2.4% |
| Blacks/African Americans | 9.7 /100 | #226 | Tragic 2.4% |
| Americans | 9.3 /100 | #227 | Tragic 2.4% |
| Immigrants | Ghana | 9.1 /100 | #228 | Tragic 2.4% |
| Immigrants | Zaire | 8.6 /100 | #229 | Tragic 2.4% |
| Sub-Saharan Africans | 8.3 /100 | #230 | Tragic 2.4% |
| Immigrants | Nonimmigrants | 7.6 /100 | #231 | Tragic 2.4% |