Macedonian vs Arapaho Single Father Households
COMPARE
Macedonian
Arapaho
Single Father Households
Single Father Households Comparison
Macedonians
Arapaho
2.0%
SINGLE FATHER HOUSEHOLDS
100.0/ 100
METRIC RATING
42nd/ 347
METRIC RANK
2.9%
SINGLE FATHER HOUSEHOLDS
0.0/ 100
METRIC RATING
313th/ 347
METRIC RANK
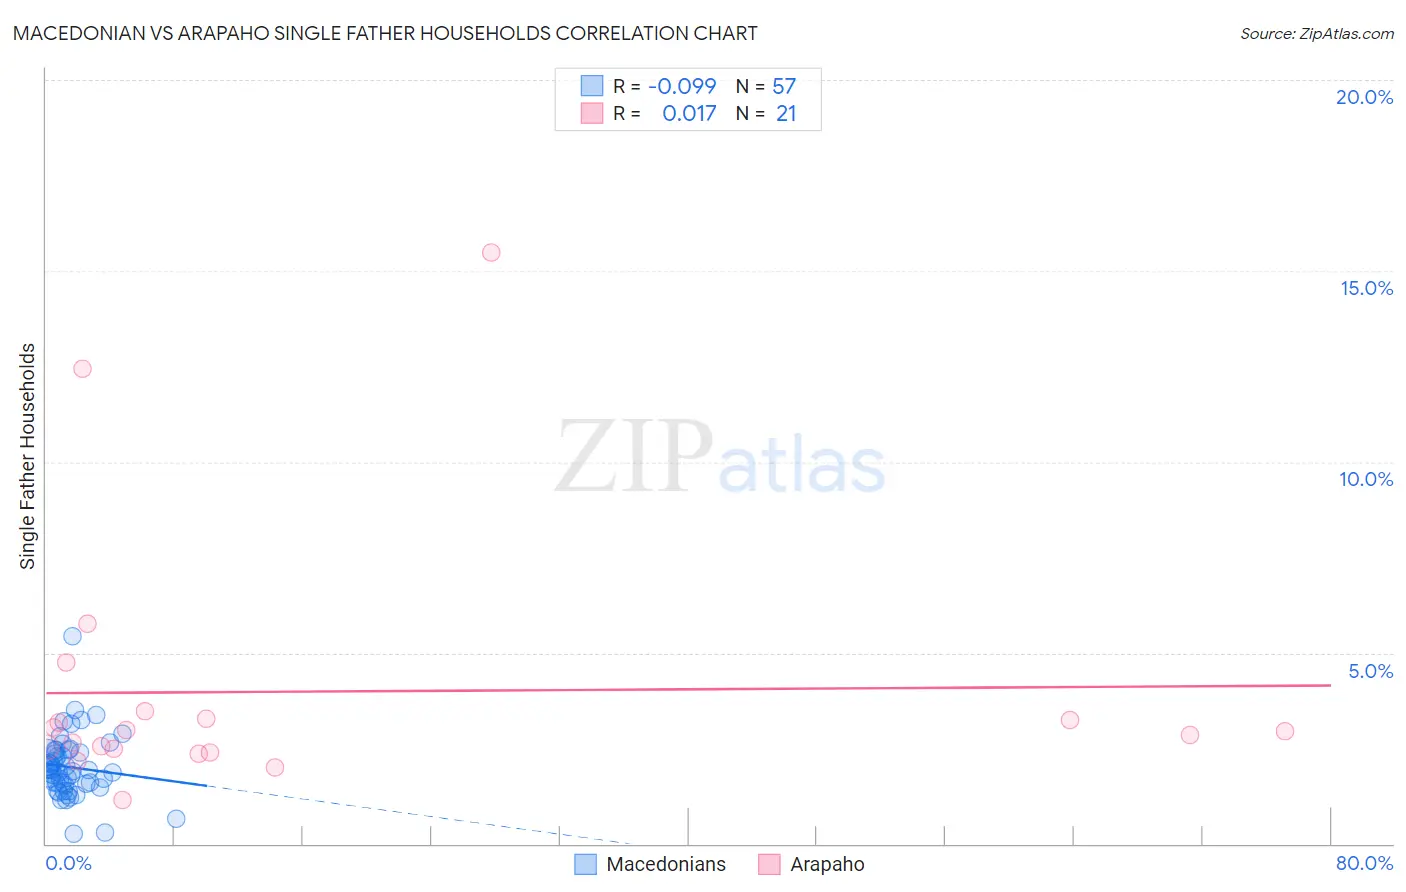
Macedonian vs Arapaho Single Father Households Correlation Chart
The statistical analysis conducted on geographies consisting of 132,178,370 people shows a slight negative correlation between the proportion of Macedonians and percentage of single father households in the United States with a correlation coefficient (R) of -0.099 and weighted average of 2.0%. Similarly, the statistical analysis conducted on geographies consisting of 29,720,466 people shows no correlation between the proportion of Arapaho and percentage of single father households in the United States with a correlation coefficient (R) of 0.017 and weighted average of 2.9%, a difference of 45.2%.
Single Father Households Correlation Summary
| Measurement | Macedonian | Arapaho |
| Minimum | 0.27% | 1.1% |
| Maximum | 5.4% | 15.5% |
| Range | 5.1% | 14.4% |
| Mean | 2.0% | 4.0% |
| Median | 1.9% | 3.0% |
| Interquartile 25% (IQ1) | 1.6% | 2.4% |
| Interquartile 75% (IQ3) | 2.4% | 3.4% |
| Interquartile Range (IQR) | 0.86% | 0.93% |
| Standard Deviation (Sample) | 0.83% | 3.5% |
| Standard Deviation (Population) | 0.82% | 3.4% |
Similar Demographics by Single Father Households
Demographics Similar to Macedonians by Single Father Households
In terms of single father households, the demographic groups most similar to Macedonians are Immigrants from Turkey (2.0%, a difference of 0.15%), Immigrants from Grenada (2.0%, a difference of 0.23%), Latvian (2.0%, a difference of 0.31%), Immigrants from Bulgaria (2.0%, a difference of 0.33%), and Russian (2.0%, a difference of 0.33%).
| Demographics | Rating | Rank | Single Father Households |
| Albanians | 100.0 /100 | #35 | Exceptional 2.0% |
| Immigrants | Belgium | 100.0 /100 | #36 | Exceptional 2.0% |
| Immigrants | St. Vincent and the Grenadines | 100.0 /100 | #37 | Exceptional 2.0% |
| Immigrants | Eastern Europe | 100.0 /100 | #38 | Exceptional 2.0% |
| Immigrants | Sri Lanka | 100.0 /100 | #39 | Exceptional 2.0% |
| Immigrants | Bulgaria | 100.0 /100 | #40 | Exceptional 2.0% |
| Immigrants | Turkey | 100.0 /100 | #41 | Exceptional 2.0% |
| Macedonians | 100.0 /100 | #42 | Exceptional 2.0% |
| Immigrants | Grenada | 100.0 /100 | #43 | Exceptional 2.0% |
| Latvians | 100.0 /100 | #44 | Exceptional 2.0% |
| Russians | 100.0 /100 | #45 | Exceptional 2.0% |
| Immigrants | Lebanon | 100.0 /100 | #46 | Exceptional 2.0% |
| Immigrants | Ukraine | 99.9 /100 | #47 | Exceptional 2.0% |
| Immigrants | Kazakhstan | 99.9 /100 | #48 | Exceptional 2.0% |
| Immigrants | Serbia | 99.9 /100 | #49 | Exceptional 2.0% |
Demographics Similar to Arapaho by Single Father Households
In terms of single father households, the demographic groups most similar to Arapaho are Salvadoran (2.9%, a difference of 0.25%), Tsimshian (2.9%, a difference of 0.42%), Cheyenne (2.9%, a difference of 0.64%), Houma (2.9%, a difference of 0.64%), and Spanish American Indian (2.9%, a difference of 0.99%).
| Demographics | Rating | Rank | Single Father Households |
| Immigrants | Azores | 0.0 /100 | #306 | Tragic 2.8% |
| Hopi | 0.0 /100 | #307 | Tragic 2.8% |
| Apache | 0.0 /100 | #308 | Tragic 2.8% |
| Central Americans | 0.0 /100 | #309 | Tragic 2.9% |
| Immigrants | Laos | 0.0 /100 | #310 | Tragic 2.9% |
| Spanish American Indians | 0.0 /100 | #311 | Tragic 2.9% |
| Tsimshian | 0.0 /100 | #312 | Tragic 2.9% |
| Arapaho | 0.0 /100 | #313 | Tragic 2.9% |
| Salvadorans | 0.0 /100 | #314 | Tragic 2.9% |
| Cheyenne | 0.0 /100 | #315 | Tragic 2.9% |
| Houma | 0.0 /100 | #316 | Tragic 2.9% |
| Immigrants | El Salvador | 0.0 /100 | #317 | Tragic 2.9% |
| Cape Verdeans | 0.0 /100 | #318 | Tragic 2.9% |
| Ute | 0.0 /100 | #319 | Tragic 3.0% |
| Guatemalans | 0.0 /100 | #320 | Tragic 3.0% |