Latvian vs Samoan Family Households with Children
COMPARE
Latvian
Samoan
Family Households with Children
Family Households with Children Comparison
Latvians
Samoans
26.4%
FAMILY HOUSEHOLDS WITH CHILDREN
0.1/ 100
METRIC RATING
294th/ 347
METRIC RANK
29.5%
FAMILY HOUSEHOLDS WITH CHILDREN
100.0/ 100
METRIC RATING
28th/ 347
METRIC RANK
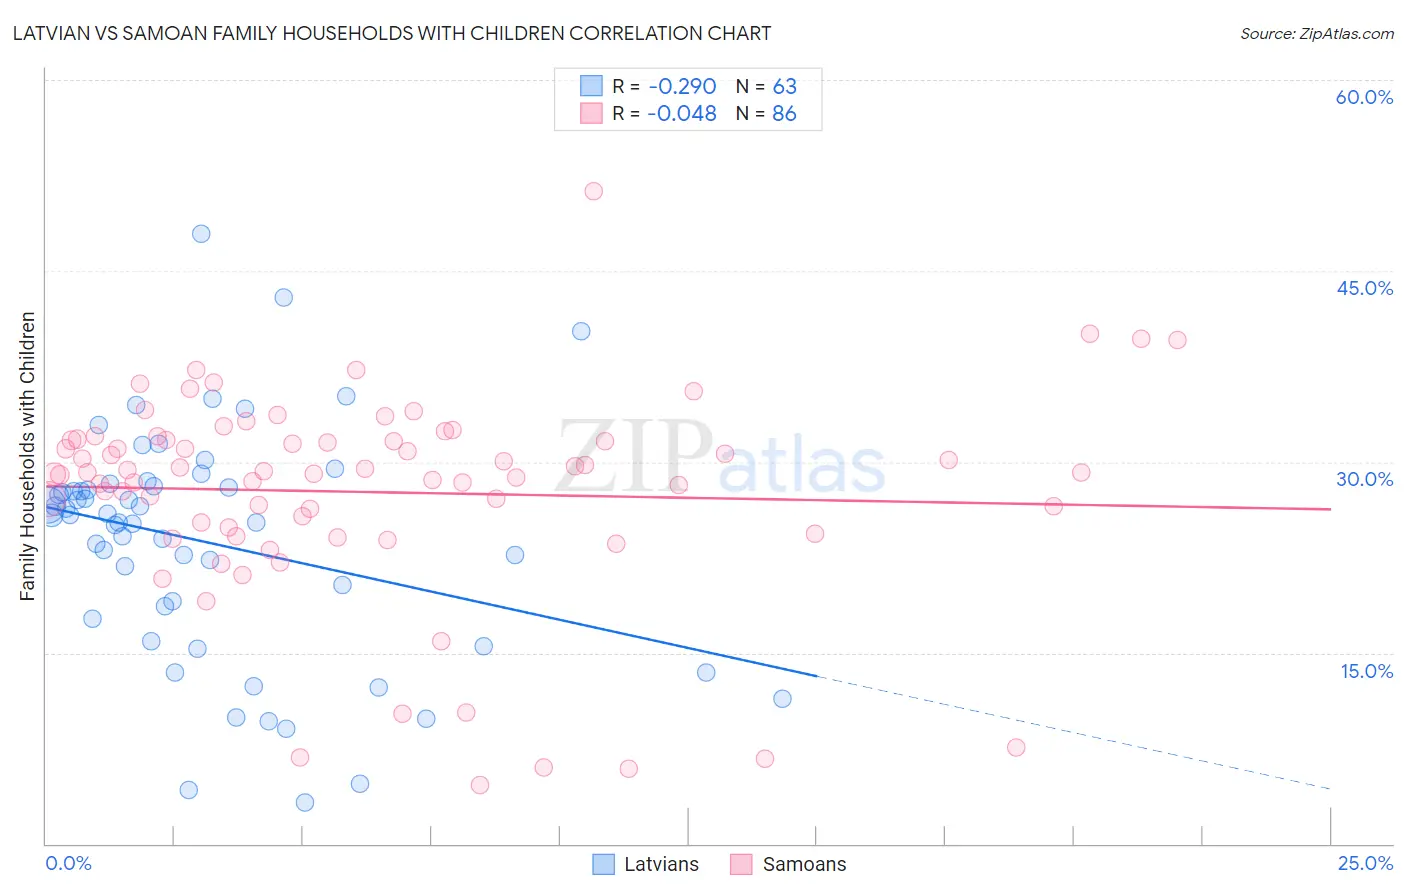
Latvian vs Samoan Family Households with Children Correlation Chart
The statistical analysis conducted on geographies consisting of 220,571,323 people shows a weak negative correlation between the proportion of Latvians and percentage of family households with children in the United States with a correlation coefficient (R) of -0.290 and weighted average of 26.4%. Similarly, the statistical analysis conducted on geographies consisting of 225,025,987 people shows no correlation between the proportion of Samoans and percentage of family households with children in the United States with a correlation coefficient (R) of -0.048 and weighted average of 29.5%, a difference of 11.5%.
Family Households with Children Correlation Summary
| Measurement | Latvian | Samoan |
| Minimum | 3.3% | 4.6% |
| Maximum | 48.0% | 51.3% |
| Range | 44.7% | 46.7% |
| Mean | 23.7% | 27.6% |
| Median | 25.8% | 29.2% |
| Interquartile 25% (IQ1) | 17.7% | 24.8% |
| Interquartile 75% (IQ3) | 28.1% | 31.8% |
| Interquartile Range (IQR) | 10.4% | 6.9% |
| Standard Deviation (Sample) | 9.1% | 8.3% |
| Standard Deviation (Population) | 9.0% | 8.2% |
Similar Demographics by Family Households with Children
Demographics Similar to Latvians by Family Households with Children
In terms of family households with children, the demographic groups most similar to Latvians are Black/African American (26.5%, a difference of 0.060%), Macedonian (26.4%, a difference of 0.080%), Croatian (26.4%, a difference of 0.10%), Polish (26.5%, a difference of 0.11%), and Armenian (26.4%, a difference of 0.11%).
| Demographics | Rating | Rank | Family Households with Children |
| Shoshone | 0.2 /100 | #287 | Tragic 26.5% |
| Russians | 0.2 /100 | #288 | Tragic 26.5% |
| Immigrants | Sweden | 0.2 /100 | #289 | Tragic 26.5% |
| Albanians | 0.2 /100 | #290 | Tragic 26.5% |
| Bahamians | 0.2 /100 | #291 | Tragic 26.5% |
| Poles | 0.2 /100 | #292 | Tragic 26.5% |
| Blacks/African Americans | 0.1 /100 | #293 | Tragic 26.5% |
| Latvians | 0.1 /100 | #294 | Tragic 26.4% |
| Macedonians | 0.1 /100 | #295 | Tragic 26.4% |
| Croatians | 0.1 /100 | #296 | Tragic 26.4% |
| Armenians | 0.1 /100 | #297 | Tragic 26.4% |
| Immigrants | Western Europe | 0.1 /100 | #298 | Tragic 26.4% |
| Trinidadians and Tobagonians | 0.1 /100 | #299 | Tragic 26.4% |
| Paiute | 0.1 /100 | #300 | Tragic 26.4% |
| Immigrants | Trinidad and Tobago | 0.1 /100 | #301 | Tragic 26.4% |
Demographics Similar to Samoans by Family Households with Children
In terms of family households with children, the demographic groups most similar to Samoans are Bolivian (29.5%, a difference of 0.0%), Yuman (29.5%, a difference of 0.040%), Immigrants from Vietnam (29.5%, a difference of 0.16%), Sri Lankan (29.5%, a difference of 0.18%), and Japanese (29.4%, a difference of 0.18%).
| Demographics | Rating | Rank | Family Households with Children |
| Immigrants | Laos | 100.0 /100 | #21 | Exceptional 29.8% |
| Malaysians | 100.0 /100 | #22 | Exceptional 29.8% |
| Mexican American Indians | 100.0 /100 | #23 | Exceptional 29.7% |
| Guamanians/Chamorros | 100.0 /100 | #24 | Exceptional 29.7% |
| Immigrants | Latin America | 100.0 /100 | #25 | Exceptional 29.7% |
| Sri Lankans | 100.0 /100 | #26 | Exceptional 29.5% |
| Immigrants | Vietnam | 100.0 /100 | #27 | Exceptional 29.5% |
| Samoans | 100.0 /100 | #28 | Exceptional 29.5% |
| Bolivians | 100.0 /100 | #29 | Exceptional 29.5% |
| Yuman | 100.0 /100 | #30 | Exceptional 29.5% |
| Japanese | 100.0 /100 | #31 | Exceptional 29.4% |
| Immigrants | Yemen | 100.0 /100 | #32 | Exceptional 29.4% |
| Venezuelans | 100.0 /100 | #33 | Exceptional 29.4% |
| Immigrants | Bolivia | 100.0 /100 | #34 | Exceptional 29.3% |
| Immigrants | Sierra Leone | 100.0 /100 | #35 | Exceptional 29.3% |