Immigrants from Zimbabwe vs Immigrants from Middle Africa Single Mother Households
COMPARE
Immigrants from Zimbabwe
Immigrants from Middle Africa
Single Mother Households
Single Mother Households Comparison
Immigrants from Zimbabwe
Immigrants from Middle Africa
6.2%
SINGLE MOTHER HOUSEHOLDS
69.9/ 100
METRIC RATING
162nd/ 347
METRIC RANK
7.7%
SINGLE MOTHER HOUSEHOLDS
0.0/ 100
METRIC RATING
286th/ 347
METRIC RANK
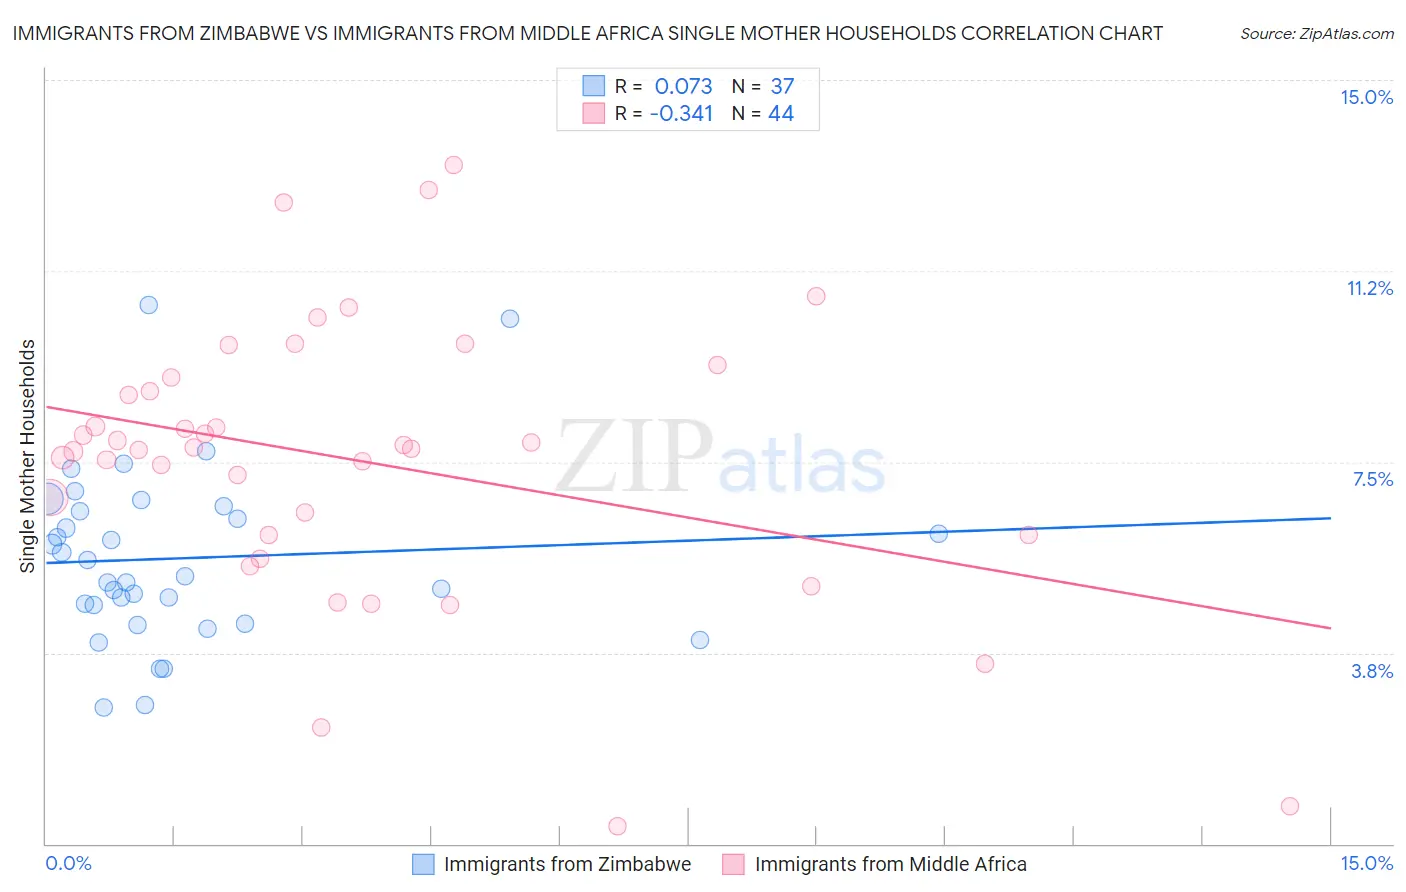
Immigrants from Zimbabwe vs Immigrants from Middle Africa Single Mother Households Correlation Chart
The statistical analysis conducted on geographies consisting of 117,740,181 people shows a slight positive correlation between the proportion of Immigrants from Zimbabwe and percentage of single mother households in the United States with a correlation coefficient (R) of 0.073 and weighted average of 6.2%. Similarly, the statistical analysis conducted on geographies consisting of 202,596,107 people shows a mild negative correlation between the proportion of Immigrants from Middle Africa and percentage of single mother households in the United States with a correlation coefficient (R) of -0.341 and weighted average of 7.7%, a difference of 25.3%.
Single Mother Households Correlation Summary
| Measurement | Immigrants from Zimbabwe | Immigrants from Middle Africa |
| Minimum | 2.7% | 0.36% |
| Maximum | 10.6% | 13.3% |
| Range | 7.9% | 13.0% |
| Mean | 5.6% | 7.5% |
| Median | 5.2% | 7.8% |
| Interquartile 25% (IQ1) | 4.5% | 6.1% |
| Interquartile 75% (IQ3) | 6.6% | 9.0% |
| Interquartile Range (IQR) | 2.1% | 3.0% |
| Standard Deviation (Sample) | 1.7% | 2.8% |
| Standard Deviation (Population) | 1.7% | 2.7% |
Similar Demographics by Single Mother Households
Demographics Similar to Immigrants from Zimbabwe by Single Mother Households
In terms of single mother households, the demographic groups most similar to Immigrants from Zimbabwe are Alsatian (6.2%, a difference of 0.16%), Immigrants from Northern Africa (6.2%, a difference of 0.25%), Immigrants from Syria (6.2%, a difference of 0.32%), Immigrants from Germany (6.1%, a difference of 0.34%), and Iraqi (6.1%, a difference of 0.42%).
| Demographics | Rating | Rank | Single Mother Households |
| Whites/Caucasians | 76.5 /100 | #155 | Good 6.1% |
| Native Hawaiians | 75.0 /100 | #156 | Good 6.1% |
| Chileans | 74.2 /100 | #157 | Good 6.1% |
| Celtics | 73.3 /100 | #158 | Good 6.1% |
| Yugoslavians | 73.1 /100 | #159 | Good 6.1% |
| Iraqis | 73.0 /100 | #160 | Good 6.1% |
| Immigrants | Germany | 72.4 /100 | #161 | Good 6.1% |
| Immigrants | Zimbabwe | 69.9 /100 | #162 | Good 6.2% |
| Alsatians | 68.7 /100 | #163 | Good 6.2% |
| Immigrants | Northern Africa | 68.0 /100 | #164 | Good 6.2% |
| Immigrants | Syria | 67.4 /100 | #165 | Good 6.2% |
| Sri Lankans | 63.9 /100 | #166 | Good 6.2% |
| Brazilians | 59.1 /100 | #167 | Average 6.2% |
| Immigrants | Chile | 58.3 /100 | #168 | Average 6.3% |
| Puget Sound Salish | 58.1 /100 | #169 | Average 6.3% |
Demographics Similar to Immigrants from Middle Africa by Single Mother Households
In terms of single mother households, the demographic groups most similar to Immigrants from Middle Africa are Immigrants from Guatemala (7.7%, a difference of 0.10%), Trinidadian and Tobagonian (7.7%, a difference of 0.11%), Immigrants from Belize (7.7%, a difference of 0.14%), Sierra Leonean (7.7%, a difference of 0.15%), and Nigerian (7.7%, a difference of 0.74%).
| Demographics | Rating | Rank | Single Mother Households |
| Immigrants | El Salvador | 0.0 /100 | #279 | Tragic 7.6% |
| Immigrants | Sierra Leone | 0.0 /100 | #280 | Tragic 7.7% |
| Immigrants | Laos | 0.0 /100 | #281 | Tragic 7.7% |
| Guatemalans | 0.0 /100 | #282 | Tragic 7.7% |
| Nigerians | 0.0 /100 | #283 | Tragic 7.7% |
| Immigrants | Belize | 0.0 /100 | #284 | Tragic 7.7% |
| Trinidadians and Tobagonians | 0.0 /100 | #285 | Tragic 7.7% |
| Immigrants | Middle Africa | 0.0 /100 | #286 | Tragic 7.7% |
| Immigrants | Guatemala | 0.0 /100 | #287 | Tragic 7.7% |
| Sierra Leoneans | 0.0 /100 | #288 | Tragic 7.7% |
| Sub-Saharan Africans | 0.0 /100 | #289 | Tragic 7.8% |
| Immigrants | Nigeria | 0.0 /100 | #290 | Tragic 7.8% |
| West Indians | 0.0 /100 | #291 | Tragic 7.8% |
| Ghanaians | 0.0 /100 | #292 | Tragic 7.8% |
| Immigrants | Cameroon | 0.0 /100 | #293 | Tragic 7.9% |