Immigrants from Zimbabwe vs Bulgarian Single Mother Households
COMPARE
Immigrants from Zimbabwe
Bulgarian
Single Mother Households
Single Mother Households Comparison
Immigrants from Zimbabwe
Bulgarians
6.2%
SINGLE MOTHER HOUSEHOLDS
69.9/ 100
METRIC RATING
162nd/ 347
METRIC RANK
5.3%
SINGLE MOTHER HOUSEHOLDS
99.7/ 100
METRIC RATING
34th/ 347
METRIC RANK
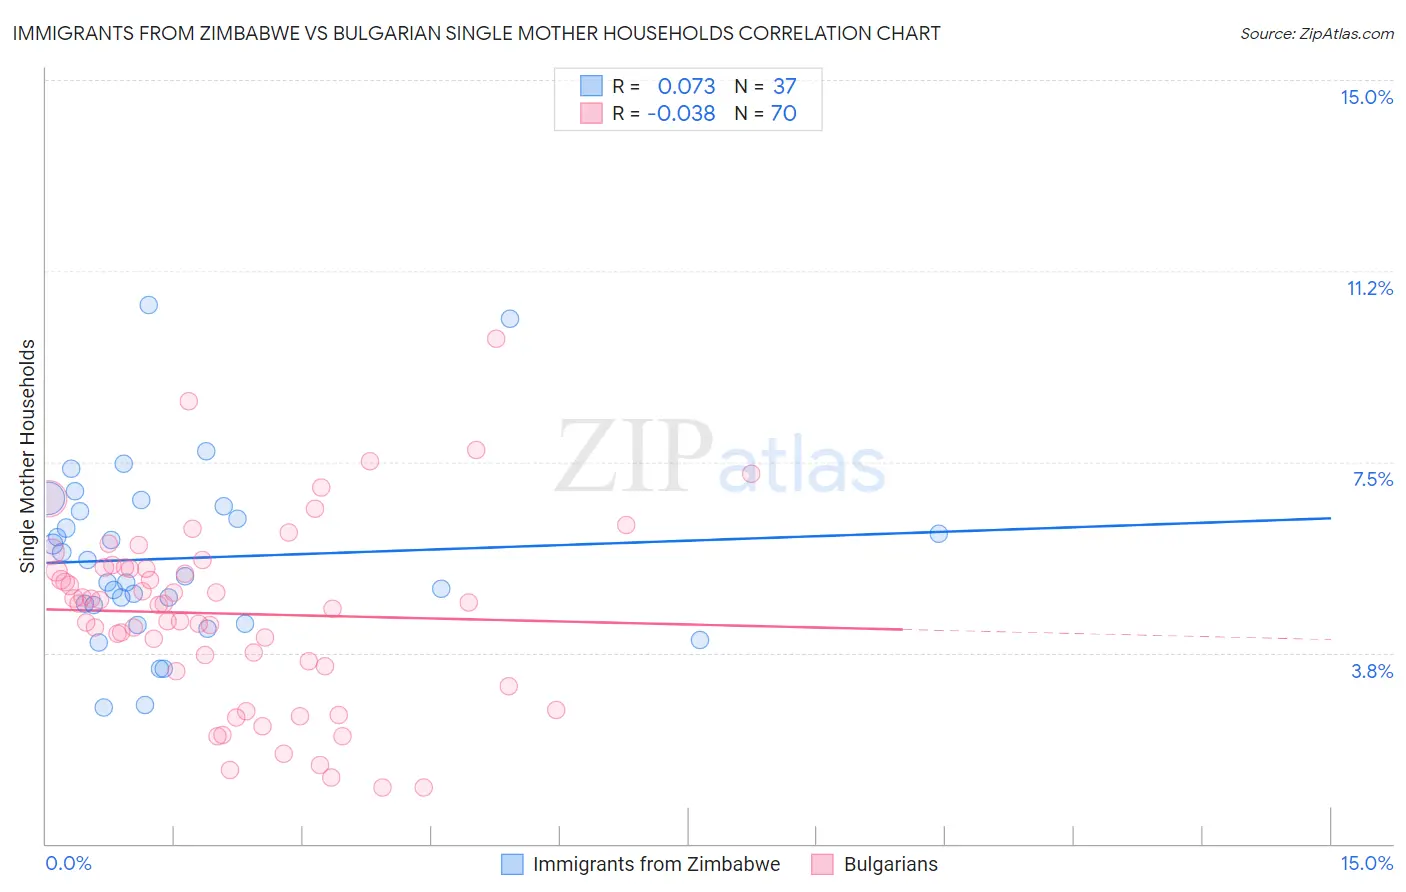
Immigrants from Zimbabwe vs Bulgarian Single Mother Households Correlation Chart
The statistical analysis conducted on geographies consisting of 117,740,181 people shows a slight positive correlation between the proportion of Immigrants from Zimbabwe and percentage of single mother households in the United States with a correlation coefficient (R) of 0.073 and weighted average of 6.2%. Similarly, the statistical analysis conducted on geographies consisting of 205,286,227 people shows no correlation between the proportion of Bulgarians and percentage of single mother households in the United States with a correlation coefficient (R) of -0.038 and weighted average of 5.3%, a difference of 16.1%.
Single Mother Households Correlation Summary
| Measurement | Immigrants from Zimbabwe | Bulgarian |
| Minimum | 2.7% | 1.1% |
| Maximum | 10.6% | 9.9% |
| Range | 7.9% | 8.8% |
| Mean | 5.6% | 4.5% |
| Median | 5.2% | 4.7% |
| Interquartile 25% (IQ1) | 4.5% | 3.5% |
| Interquartile 75% (IQ3) | 6.6% | 5.4% |
| Interquartile Range (IQR) | 2.1% | 1.9% |
| Standard Deviation (Sample) | 1.7% | 1.8% |
| Standard Deviation (Population) | 1.7% | 1.8% |
Similar Demographics by Single Mother Households
Demographics Similar to Immigrants from Zimbabwe by Single Mother Households
In terms of single mother households, the demographic groups most similar to Immigrants from Zimbabwe are Alsatian (6.2%, a difference of 0.16%), Immigrants from Northern Africa (6.2%, a difference of 0.25%), Immigrants from Syria (6.2%, a difference of 0.32%), Immigrants from Germany (6.1%, a difference of 0.34%), and Iraqi (6.1%, a difference of 0.42%).
| Demographics | Rating | Rank | Single Mother Households |
| Whites/Caucasians | 76.5 /100 | #155 | Good 6.1% |
| Native Hawaiians | 75.0 /100 | #156 | Good 6.1% |
| Chileans | 74.2 /100 | #157 | Good 6.1% |
| Celtics | 73.3 /100 | #158 | Good 6.1% |
| Yugoslavians | 73.1 /100 | #159 | Good 6.1% |
| Iraqis | 73.0 /100 | #160 | Good 6.1% |
| Immigrants | Germany | 72.4 /100 | #161 | Good 6.1% |
| Immigrants | Zimbabwe | 69.9 /100 | #162 | Good 6.2% |
| Alsatians | 68.7 /100 | #163 | Good 6.2% |
| Immigrants | Northern Africa | 68.0 /100 | #164 | Good 6.2% |
| Immigrants | Syria | 67.4 /100 | #165 | Good 6.2% |
| Sri Lankans | 63.9 /100 | #166 | Good 6.2% |
| Brazilians | 59.1 /100 | #167 | Average 6.2% |
| Immigrants | Chile | 58.3 /100 | #168 | Average 6.3% |
| Puget Sound Salish | 58.1 /100 | #169 | Average 6.3% |
Demographics Similar to Bulgarians by Single Mother Households
In terms of single mother households, the demographic groups most similar to Bulgarians are Immigrants from Switzerland (5.3%, a difference of 0.020%), Immigrants from Northern Europe (5.3%, a difference of 0.040%), Immigrants from Czechoslovakia (5.3%, a difference of 0.24%), Immigrants from Belgium (5.3%, a difference of 0.38%), and Immigrants from Korea (5.3%, a difference of 0.41%).
| Demographics | Rating | Rank | Single Mother Households |
| Bhutanese | 99.7 /100 | #27 | Exceptional 5.3% |
| Russians | 99.7 /100 | #28 | Exceptional 5.3% |
| Latvians | 99.7 /100 | #29 | Exceptional 5.3% |
| Burmese | 99.7 /100 | #30 | Exceptional 5.3% |
| Immigrants | Korea | 99.7 /100 | #31 | Exceptional 5.3% |
| Cambodians | 99.7 /100 | #32 | Exceptional 5.3% |
| Immigrants | Switzerland | 99.7 /100 | #33 | Exceptional 5.3% |
| Bulgarians | 99.7 /100 | #34 | Exceptional 5.3% |
| Immigrants | Northern Europe | 99.7 /100 | #35 | Exceptional 5.3% |
| Immigrants | Czechoslovakia | 99.7 /100 | #36 | Exceptional 5.3% |
| Immigrants | Belgium | 99.7 /100 | #37 | Exceptional 5.3% |
| Immigrants | Serbia | 99.6 /100 | #38 | Exceptional 5.4% |
| Immigrants | Sweden | 99.6 /100 | #39 | Exceptional 5.4% |
| Estonians | 99.6 /100 | #40 | Exceptional 5.4% |
| Immigrants | Greece | 99.5 /100 | #41 | Exceptional 5.4% |