Immigrants from Ukraine vs White/Caucasian Currently Married
COMPARE
Immigrants from Ukraine
White/Caucasian
Currently Married
Currently Married Comparison
Immigrants from Ukraine
Whites/Caucasians
47.9%
CURRENTLY MARRIED
94.8/ 100
METRIC RATING
97th/ 347
METRIC RANK
48.6%
CURRENTLY MARRIED
99.0/ 100
METRIC RATING
51st/ 347
METRIC RANK
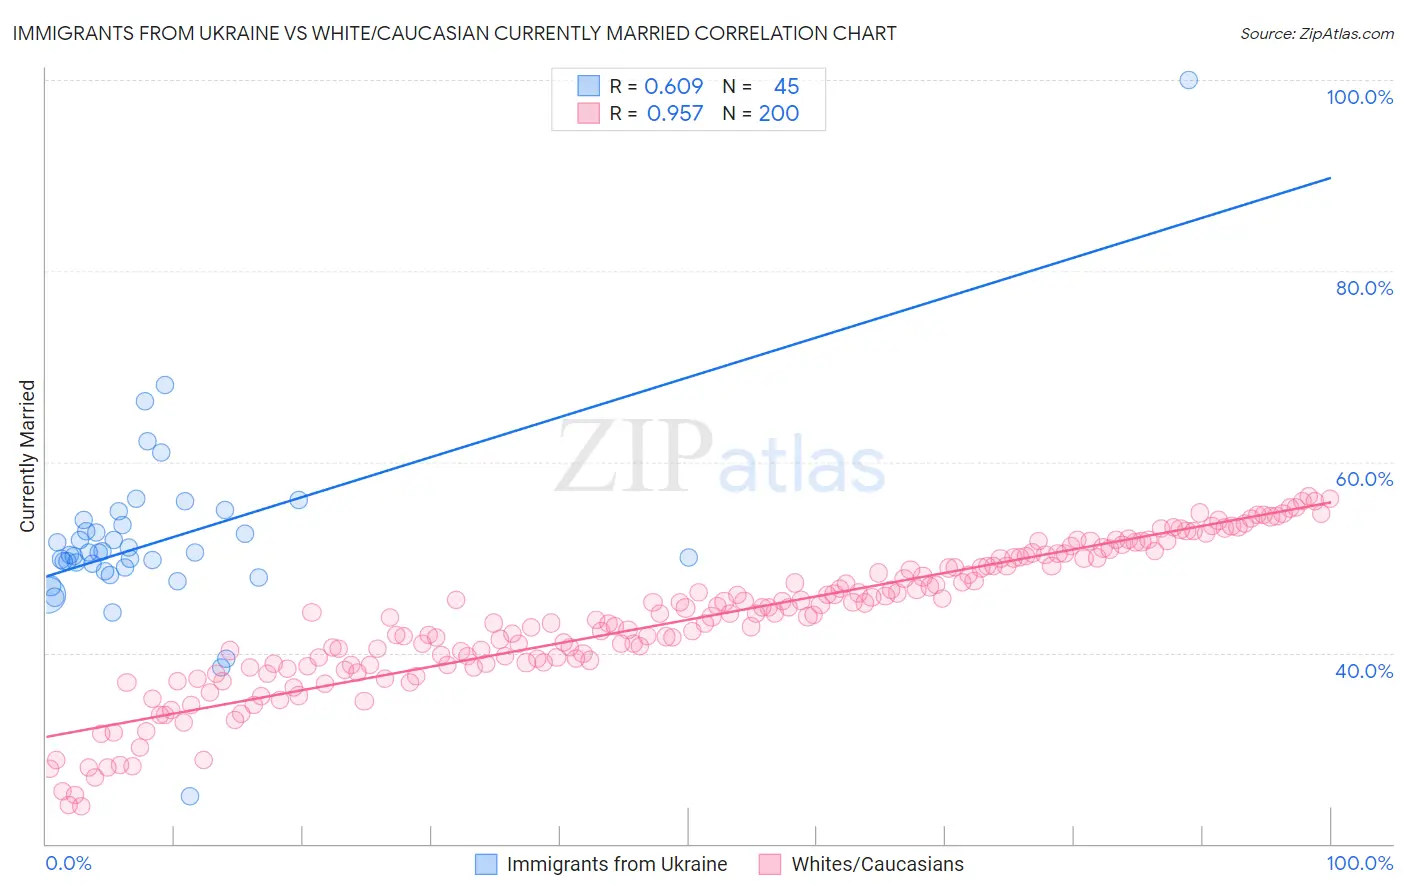
Immigrants from Ukraine vs White/Caucasian Currently Married Correlation Chart
The statistical analysis conducted on geographies consisting of 289,694,818 people shows a significant positive correlation between the proportion of Immigrants from Ukraine and percentage of population currently married in the United States with a correlation coefficient (R) of 0.609 and weighted average of 47.9%. Similarly, the statistical analysis conducted on geographies consisting of 585,061,010 people shows a perfect positive correlation between the proportion of Whites/Caucasians and percentage of population currently married in the United States with a correlation coefficient (R) of 0.957 and weighted average of 48.6%, a difference of 1.5%.
Currently Married Correlation Summary
| Measurement | Immigrants from Ukraine | White/Caucasian |
| Minimum | 25.0% | 24.0% |
| Maximum | 100.0% | 56.4% |
| Range | 75.0% | 32.4% |
| Mean | 51.9% | 43.5% |
| Median | 50.5% | 44.0% |
| Interquartile 25% (IQ1) | 48.7% | 38.8% |
| Interquartile 75% (IQ3) | 53.6% | 49.5% |
| Interquartile Range (IQR) | 4.9% | 10.7% |
| Standard Deviation (Sample) | 10.0% | 7.4% |
| Standard Deviation (Population) | 9.9% | 7.4% |
Similar Demographics by Currently Married
Demographics Similar to Immigrants from Ukraine by Currently Married
In terms of currently married, the demographic groups most similar to Immigrants from Ukraine are Immigrants from Bulgaria (47.9%, a difference of 0.010%), Egyptian (47.9%, a difference of 0.010%), Immigrants from China (47.9%, a difference of 0.020%), Native Hawaiian (47.9%, a difference of 0.040%), and Lebanese (47.9%, a difference of 0.060%).
| Demographics | Rating | Rank | Currently Married |
| Americans | 95.7 /100 | #90 | Exceptional 48.0% |
| Immigrants | Bolivia | 95.6 /100 | #91 | Exceptional 47.9% |
| Koreans | 95.4 /100 | #92 | Exceptional 47.9% |
| Lebanese | 95.1 /100 | #93 | Exceptional 47.9% |
| Native Hawaiians | 95.0 /100 | #94 | Exceptional 47.9% |
| Immigrants | Bulgaria | 94.8 /100 | #95 | Exceptional 47.9% |
| Egyptians | 94.8 /100 | #96 | Exceptional 47.9% |
| Immigrants | Ukraine | 94.8 /100 | #97 | Exceptional 47.9% |
| Immigrants | China | 94.7 /100 | #98 | Exceptional 47.9% |
| Immigrants | Sweden | 94.3 /100 | #99 | Exceptional 47.8% |
| Celtics | 94.2 /100 | #100 | Exceptional 47.8% |
| Immigrants | Germany | 94.1 /100 | #101 | Exceptional 47.8% |
| Turks | 93.9 /100 | #102 | Exceptional 47.8% |
| Cypriots | 93.7 /100 | #103 | Exceptional 47.8% |
| Serbians | 93.6 /100 | #104 | Exceptional 47.8% |
Demographics Similar to Whites/Caucasians by Currently Married
In terms of currently married, the demographic groups most similar to Whites/Caucasians are Iranian (48.6%, a difference of 0.010%), Bhutanese (48.6%, a difference of 0.070%), Russian (48.6%, a difference of 0.090%), Austrian (48.7%, a difference of 0.20%), and Immigrants from Austria (48.5%, a difference of 0.20%).
| Demographics | Rating | Rank | Currently Married |
| Immigrants | North America | 99.3 /100 | #44 | Exceptional 48.7% |
| Belgians | 99.3 /100 | #45 | Exceptional 48.7% |
| Immigrants | Iran | 99.2 /100 | #46 | Exceptional 48.7% |
| Northern Europeans | 99.2 /100 | #47 | Exceptional 48.7% |
| Austrians | 99.2 /100 | #48 | Exceptional 48.7% |
| Bhutanese | 99.1 /100 | #49 | Exceptional 48.6% |
| Iranians | 99.0 /100 | #50 | Exceptional 48.6% |
| Whites/Caucasians | 99.0 /100 | #51 | Exceptional 48.6% |
| Russians | 98.9 /100 | #52 | Exceptional 48.6% |
| Immigrants | Austria | 98.8 /100 | #53 | Exceptional 48.5% |
| Immigrants | Moldova | 98.7 /100 | #54 | Exceptional 48.5% |
| Immigrants | North Macedonia | 98.7 /100 | #55 | Exceptional 48.5% |
| Latvians | 98.7 /100 | #56 | Exceptional 48.5% |
| Immigrants | Netherlands | 98.6 /100 | #57 | Exceptional 48.5% |
| French | 98.6 /100 | #58 | Exceptional 48.4% |