Immigrants from Ukraine vs Spanish American Indian Family Households with Children
COMPARE
Immigrants from Ukraine
Spanish American Indian
Family Households with Children
Family Households with Children Comparison
Immigrants from Ukraine
Spanish American Indians
27.2%
FAMILY HOUSEHOLDS WITH CHILDREN
14.4/ 100
METRIC RATING
210th/ 347
METRIC RANK
29.1%
FAMILY HOUSEHOLDS WITH CHILDREN
100.0/ 100
METRIC RATING
42nd/ 347
METRIC RANK
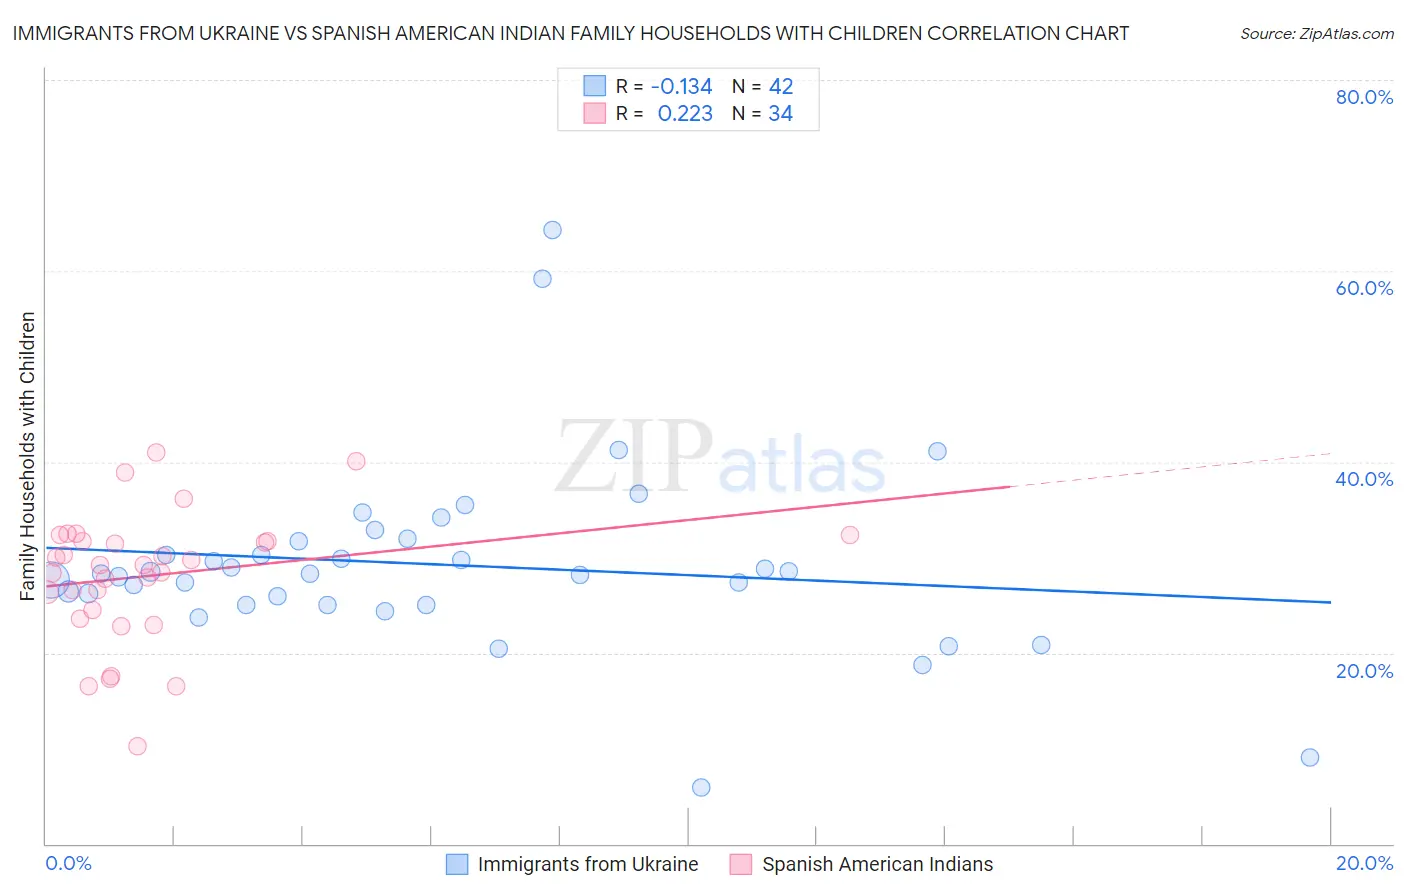
Immigrants from Ukraine vs Spanish American Indian Family Households with Children Correlation Chart
The statistical analysis conducted on geographies consisting of 289,589,077 people shows a poor negative correlation between the proportion of Immigrants from Ukraine and percentage of family households with children in the United States with a correlation coefficient (R) of -0.134 and weighted average of 27.2%. Similarly, the statistical analysis conducted on geographies consisting of 73,143,666 people shows a weak positive correlation between the proportion of Spanish American Indians and percentage of family households with children in the United States with a correlation coefficient (R) of 0.223 and weighted average of 29.1%, a difference of 7.1%.
Family Households with Children Correlation Summary
| Measurement | Immigrants from Ukraine | Spanish American Indian |
| Minimum | 5.9% | 10.3% |
| Maximum | 64.3% | 41.0% |
| Range | 58.4% | 30.8% |
| Mean | 29.2% | 28.1% |
| Median | 28.3% | 29.2% |
| Interquartile 25% (IQ1) | 25.0% | 24.4% |
| Interquartile 75% (IQ3) | 31.7% | 31.7% |
| Interquartile Range (IQR) | 6.7% | 7.3% |
| Standard Deviation (Sample) | 9.9% | 6.8% |
| Standard Deviation (Population) | 9.8% | 6.7% |
Similar Demographics by Family Households with Children
Demographics Similar to Immigrants from Ukraine by Family Households with Children
In terms of family households with children, the demographic groups most similar to Immigrants from Ukraine are Welsh (27.2%, a difference of 0.010%), Immigrants from Dominica (27.2%, a difference of 0.020%), Okinawan (27.2%, a difference of 0.030%), Dutch West Indian (27.2%, a difference of 0.060%), and African (27.2%, a difference of 0.070%).
| Demographics | Rating | Rank | Family Households with Children |
| Kiowa | 22.2 /100 | #203 | Fair 27.3% |
| Immigrants | Sudan | 21.6 /100 | #204 | Fair 27.3% |
| Immigrants | Haiti | 20.3 /100 | #205 | Fair 27.2% |
| Immigrants | Micronesia | 20.2 /100 | #206 | Fair 27.2% |
| Haitians | 19.8 /100 | #207 | Poor 27.2% |
| Immigrants | Poland | 16.4 /100 | #208 | Poor 27.2% |
| Dutch West Indians | 15.8 /100 | #209 | Poor 27.2% |
| Immigrants | Ukraine | 14.4 /100 | #210 | Poor 27.2% |
| Welsh | 14.2 /100 | #211 | Poor 27.2% |
| Immigrants | Dominica | 13.9 /100 | #212 | Poor 27.2% |
| Okinawans | 13.7 /100 | #213 | Poor 27.2% |
| Africans | 13.0 /100 | #214 | Poor 27.2% |
| Northern Europeans | 12.8 /100 | #215 | Poor 27.2% |
| Cubans | 12.2 /100 | #216 | Poor 27.1% |
| U.S. Virgin Islanders | 12.1 /100 | #217 | Poor 27.1% |
Demographics Similar to Spanish American Indians by Family Households with Children
In terms of family households with children, the demographic groups most similar to Spanish American Indians are Immigrants from South Eastern Asia (29.1%, a difference of 0.0%), Central American (29.1%, a difference of 0.090%), Yaqui (29.1%, a difference of 0.11%), Asian (29.1%, a difference of 0.19%), and Immigrants from Taiwan (29.0%, a difference of 0.23%).
| Demographics | Rating | Rank | Family Households with Children |
| Immigrants | Sierra Leone | 100.0 /100 | #35 | Exceptional 29.3% |
| Immigrants | Venezuela | 100.0 /100 | #36 | Exceptional 29.3% |
| Immigrants | Cameroon | 100.0 /100 | #37 | Exceptional 29.2% |
| Koreans | 100.0 /100 | #38 | Exceptional 29.2% |
| Yaqui | 100.0 /100 | #39 | Exceptional 29.1% |
| Central Americans | 100.0 /100 | #40 | Exceptional 29.1% |
| Immigrants | South Eastern Asia | 100.0 /100 | #41 | Exceptional 29.1% |
| Spanish American Indians | 100.0 /100 | #42 | Exceptional 29.1% |
| Asians | 100.0 /100 | #43 | Exceptional 29.1% |
| Immigrants | Taiwan | 100.0 /100 | #44 | Exceptional 29.0% |
| Fijians | 100.0 /100 | #45 | Exceptional 29.0% |
| Immigrants | Philippines | 100.0 /100 | #46 | Exceptional 29.0% |
| Peruvians | 100.0 /100 | #47 | Exceptional 29.0% |
| Apache | 100.0 /100 | #48 | Exceptional 29.0% |
| Jordanians | 100.0 /100 | #49 | Exceptional 29.0% |