Egyptian vs Spanish American Indian Family Households with Children
COMPARE
Egyptian
Spanish American Indian
Family Households with Children
Family Households with Children Comparison
Egyptians
Spanish American Indians
28.6%
FAMILY HOUSEHOLDS WITH CHILDREN
99.9/ 100
METRIC RATING
62nd/ 347
METRIC RANK
29.1%
FAMILY HOUSEHOLDS WITH CHILDREN
100.0/ 100
METRIC RATING
42nd/ 347
METRIC RANK
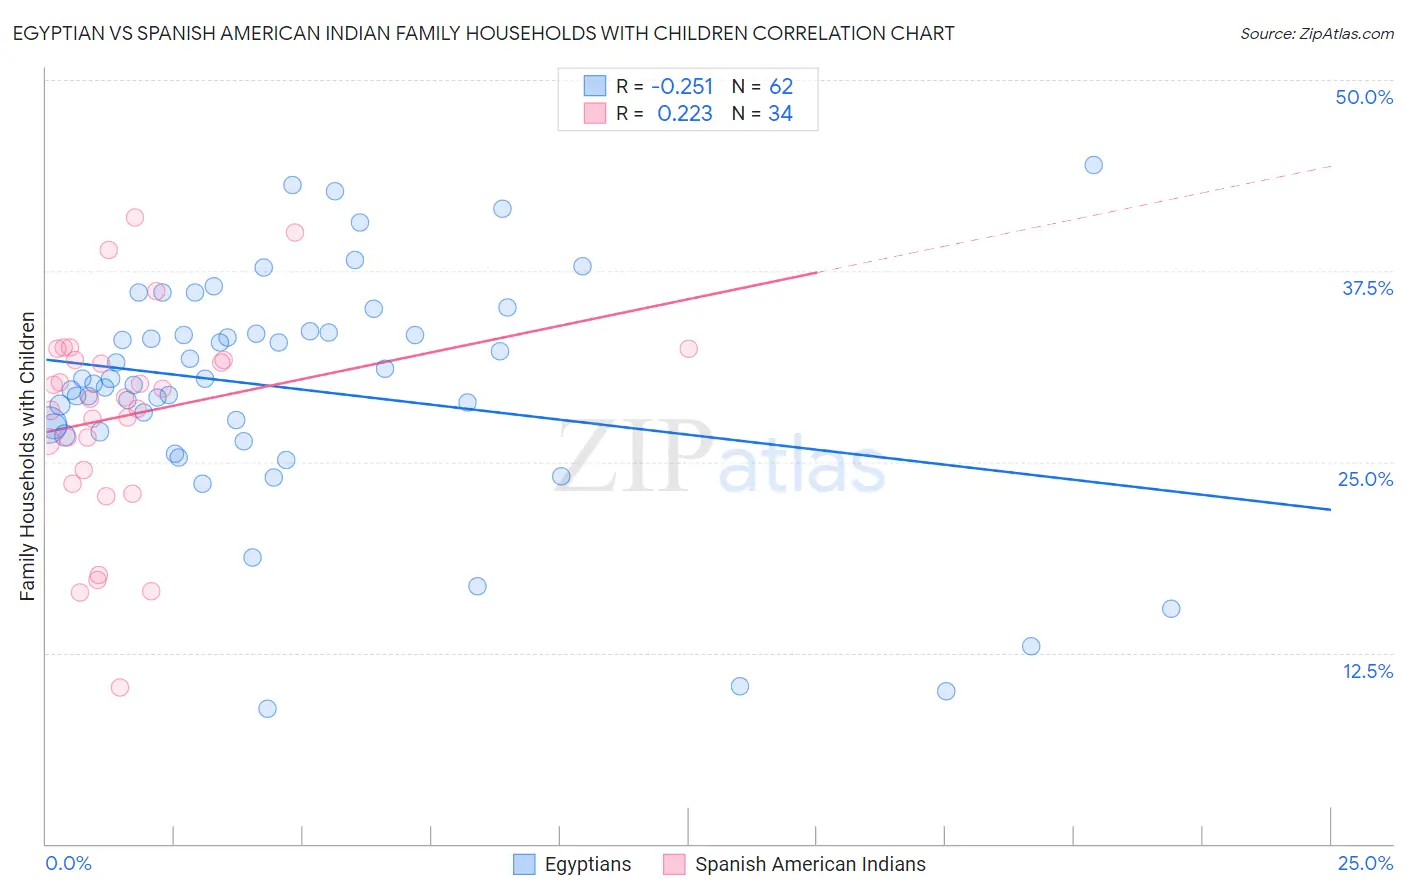
Egyptian vs Spanish American Indian Family Households with Children Correlation Chart
The statistical analysis conducted on geographies consisting of 276,723,802 people shows a weak negative correlation between the proportion of Egyptians and percentage of family households with children in the United States with a correlation coefficient (R) of -0.251 and weighted average of 28.6%. Similarly, the statistical analysis conducted on geographies consisting of 73,143,666 people shows a weak positive correlation between the proportion of Spanish American Indians and percentage of family households with children in the United States with a correlation coefficient (R) of 0.223 and weighted average of 29.1%, a difference of 1.9%.
Family Households with Children Correlation Summary
| Measurement | Egyptian | Spanish American Indian |
| Minimum | 8.8% | 10.3% |
| Maximum | 44.4% | 41.0% |
| Range | 35.6% | 30.8% |
| Mean | 29.8% | 28.1% |
| Median | 30.3% | 29.2% |
| Interquartile 25% (IQ1) | 27.0% | 24.4% |
| Interquartile 75% (IQ3) | 33.5% | 31.7% |
| Interquartile Range (IQR) | 6.5% | 7.3% |
| Standard Deviation (Sample) | 7.7% | 6.8% |
| Standard Deviation (Population) | 7.6% | 6.7% |
Demographics Similar to Egyptians and Spanish American Indians by Family Households with Children
In terms of family households with children, the demographic groups most similar to Egyptians are Immigrants from Ghana (28.6%, a difference of 0.0%), Hmong (28.6%, a difference of 0.080%), Immigrants from Nigeria (28.6%, a difference of 0.13%), Hawaiian (28.7%, a difference of 0.46%), and Danish (28.7%, a difference of 0.61%). Similarly, the demographic groups most similar to Spanish American Indians are Asian (29.1%, a difference of 0.19%), Immigrants from Taiwan (29.0%, a difference of 0.23%), Fijian (29.0%, a difference of 0.28%), Immigrants from Philippines (29.0%, a difference of 0.37%), and Peruvian (29.0%, a difference of 0.38%).
| Demographics | Rating | Rank | Family Households with Children |
| Spanish American Indians | 100.0 /100 | #42 | Exceptional 29.1% |
| Asians | 100.0 /100 | #43 | Exceptional 29.1% |
| Immigrants | Taiwan | 100.0 /100 | #44 | Exceptional 29.0% |
| Fijians | 100.0 /100 | #45 | Exceptional 29.0% |
| Immigrants | Philippines | 100.0 /100 | #46 | Exceptional 29.0% |
| Peruvians | 100.0 /100 | #47 | Exceptional 29.0% |
| Apache | 100.0 /100 | #48 | Exceptional 29.0% |
| Jordanians | 100.0 /100 | #49 | Exceptional 29.0% |
| Immigrants | Immigrants | 100.0 /100 | #50 | Exceptional 28.9% |
| Immigrants | Peru | 100.0 /100 | #51 | Exceptional 28.9% |
| Guatemalans | 100.0 /100 | #52 | Exceptional 28.9% |
| Immigrants | Cambodia | 100.0 /100 | #53 | Exceptional 28.9% |
| Sierra Leoneans | 100.0 /100 | #54 | Exceptional 28.9% |
| Immigrants | Asia | 100.0 /100 | #55 | Exceptional 28.8% |
| Immigrants | Guatemala | 100.0 /100 | #56 | Exceptional 28.8% |
| Danes | 100.0 /100 | #57 | Exceptional 28.7% |
| Hawaiians | 100.0 /100 | #58 | Exceptional 28.7% |
| Immigrants | Nigeria | 100.0 /100 | #59 | Exceptional 28.6% |
| Hmong | 99.9 /100 | #60 | Exceptional 28.6% |
| Immigrants | Ghana | 99.9 /100 | #61 | Exceptional 28.6% |
| Egyptians | 99.9 /100 | #62 | Exceptional 28.6% |