Immigrants from Sierra Leone vs Immigrants from Caribbean Currently Married
COMPARE
Immigrants from Sierra Leone
Immigrants from Caribbean
Currently Married
Currently Married Comparison
Immigrants from Sierra Leone
Immigrants from Caribbean
43.8%
CURRENTLY MARRIED
0.1/ 100
METRIC RATING
259th/ 347
METRIC RANK
41.3%
CURRENTLY MARRIED
0.0/ 100
METRIC RATING
316th/ 347
METRIC RANK
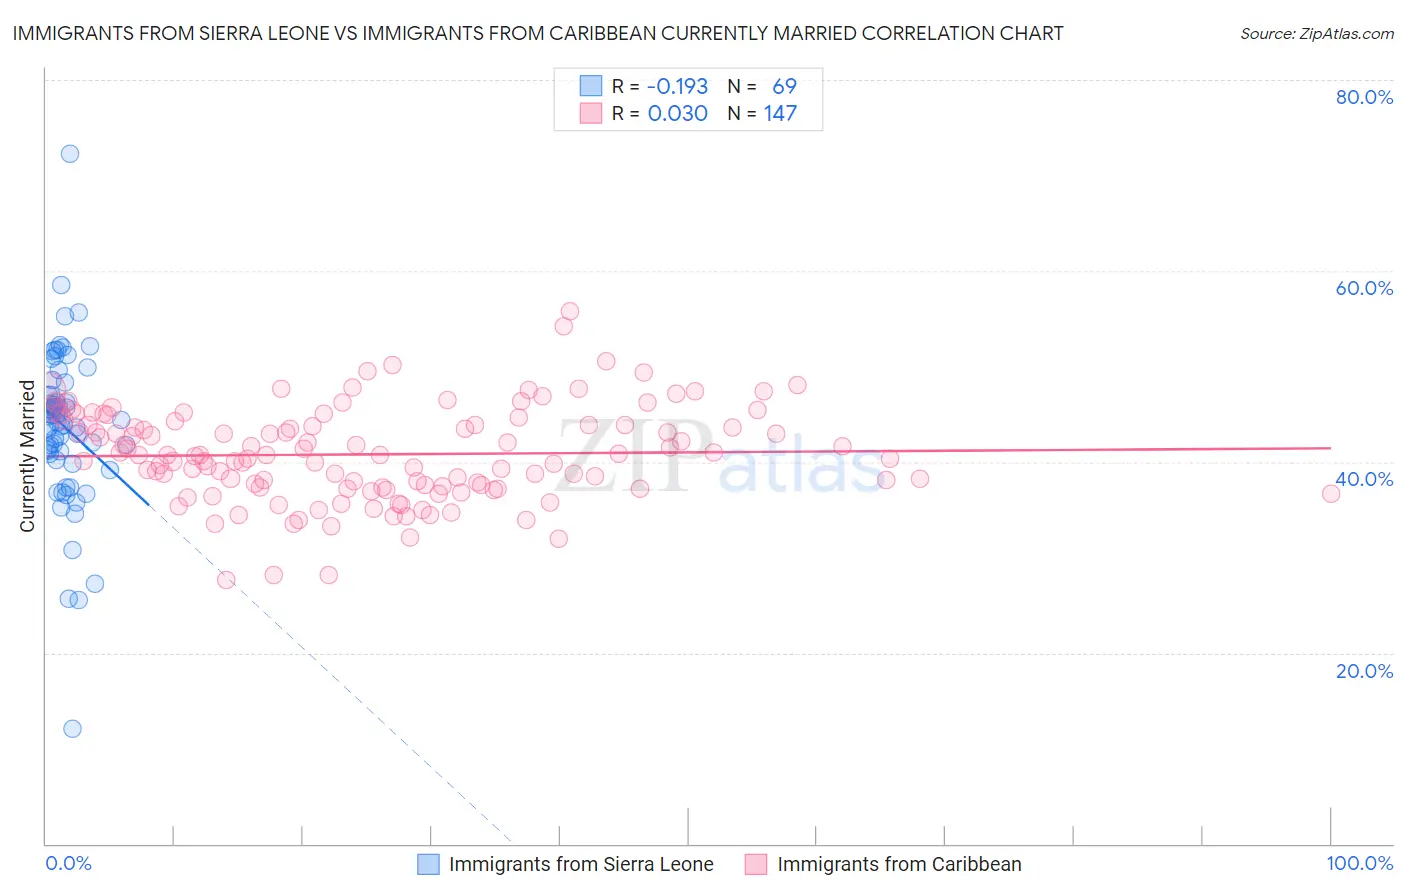
Immigrants from Sierra Leone vs Immigrants from Caribbean Currently Married Correlation Chart
The statistical analysis conducted on geographies consisting of 101,652,138 people shows a poor negative correlation between the proportion of Immigrants from Sierra Leone and percentage of population currently married in the United States with a correlation coefficient (R) of -0.193 and weighted average of 43.8%. Similarly, the statistical analysis conducted on geographies consisting of 450,001,379 people shows no correlation between the proportion of Immigrants from Caribbean and percentage of population currently married in the United States with a correlation coefficient (R) of 0.030 and weighted average of 41.3%, a difference of 6.1%.
Currently Married Correlation Summary
| Measurement | Immigrants from Sierra Leone | Immigrants from Caribbean |
| Minimum | 12.0% | 27.6% |
| Maximum | 72.3% | 55.8% |
| Range | 60.3% | 28.2% |
| Mean | 43.7% | 40.8% |
| Median | 44.4% | 40.7% |
| Interquartile 25% (IQ1) | 40.5% | 37.3% |
| Interquartile 75% (IQ3) | 47.7% | 43.9% |
| Interquartile Range (IQR) | 7.1% | 6.6% |
| Standard Deviation (Sample) | 8.4% | 4.9% |
| Standard Deviation (Population) | 8.3% | 4.9% |
Similar Demographics by Currently Married
Demographics Similar to Immigrants from Sierra Leone by Currently Married
In terms of currently married, the demographic groups most similar to Immigrants from Sierra Leone are Immigrants from Latin America (43.8%, a difference of 0.060%), Immigrants from Nicaragua (43.7%, a difference of 0.11%), Ute (43.9%, a difference of 0.21%), Immigrants from Africa (43.9%, a difference of 0.22%), and Bangladeshi (43.7%, a difference of 0.25%).
| Demographics | Rating | Rank | Currently Married |
| Hispanics or Latinos | 0.3 /100 | #252 | Tragic 44.1% |
| Immigrants | Central America | 0.3 /100 | #253 | Tragic 44.1% |
| Vietnamese | 0.2 /100 | #254 | Tragic 44.0% |
| Yakama | 0.2 /100 | #255 | Tragic 44.0% |
| Shoshone | 0.2 /100 | #256 | Tragic 44.0% |
| Immigrants | Africa | 0.2 /100 | #257 | Tragic 43.9% |
| Ute | 0.2 /100 | #258 | Tragic 43.9% |
| Immigrants | Sierra Leone | 0.1 /100 | #259 | Tragic 43.8% |
| Immigrants | Latin America | 0.1 /100 | #260 | Tragic 43.8% |
| Immigrants | Nicaragua | 0.1 /100 | #261 | Tragic 43.7% |
| Bangladeshis | 0.1 /100 | #262 | Tragic 43.7% |
| Immigrants | Cuba | 0.1 /100 | #263 | Tragic 43.7% |
| Sudanese | 0.1 /100 | #264 | Tragic 43.7% |
| Immigrants | Bangladesh | 0.1 /100 | #265 | Tragic 43.6% |
| Ecuadorians | 0.1 /100 | #266 | Tragic 43.6% |
Demographics Similar to Immigrants from Caribbean by Currently Married
In terms of currently married, the demographic groups most similar to Immigrants from Caribbean are Haitian (41.3%, a difference of 0.020%), Inupiat (41.3%, a difference of 0.060%), West Indian (41.3%, a difference of 0.15%), Bahamian (41.2%, a difference of 0.20%), and Jamaican (41.4%, a difference of 0.22%).
| Demographics | Rating | Rank | Currently Married |
| Immigrants | Liberia | 0.0 /100 | #309 | Tragic 41.8% |
| Guyanese | 0.0 /100 | #310 | Tragic 41.6% |
| Trinidadians and Tobagonians | 0.0 /100 | #311 | Tragic 41.5% |
| Somalis | 0.0 /100 | #312 | Tragic 41.5% |
| Jamaicans | 0.0 /100 | #313 | Tragic 41.4% |
| West Indians | 0.0 /100 | #314 | Tragic 41.3% |
| Inupiat | 0.0 /100 | #315 | Tragic 41.3% |
| Immigrants | Caribbean | 0.0 /100 | #316 | Tragic 41.3% |
| Haitians | 0.0 /100 | #317 | Tragic 41.3% |
| Bahamians | 0.0 /100 | #318 | Tragic 41.2% |
| Immigrants | Somalia | 0.0 /100 | #319 | Tragic 41.2% |
| Immigrants | Jamaica | 0.0 /100 | #320 | Tragic 41.1% |
| Immigrants | Congo | 0.0 /100 | #321 | Tragic 41.1% |
| Immigrants | Haiti | 0.0 /100 | #322 | Tragic 41.0% |
| Immigrants | West Indies | 0.0 /100 | #323 | Tragic 40.7% |