Immigrants from Lithuania vs Immigrants from Caribbean Currently Married

COMPARE

Immigrants from Lithuania
Race
Ancestry
AfghanAfricanAlaska NativeAlaskan AthabascanAlbanianAleutAlsatianAmericanApacheArabArapahoArgentineanArmenianAssyrian/Chaldean/SyriacAustralianAustrianBahamianBangladeshiBarbadianBasqueBelgianBelizeanBermudanBhutaneseBlackfeetBolivianBrazilianBritishBritish West IndianBulgarianBurmeseCajunCambodianCanadianCape VerdeanCarpatho RusynCelticCentral AmericanCentral American IndianCherokeeCheyenneChickasawChileanChineseChippewaChoctawColombianColvilleComancheCosta RicanCreeCreekCroatianCrowCubanCypriotCzechCzechoslovakianDanishDelawareDominicanDutchDutch West IndianEastern EuropeanEcuadorianEgyptianEnglishEstonianEthiopianEuropeanFijianFilipinoFinnishFrenchFrench American IndianFrench CanadianGermanGerman RussianGhanaianGreekGuamanian/ChamorroGuatemalanGuyaneseHaitianHmongHonduranHopiHoumaHungarianIcelanderIndian (Asian)IndonesianInupiatIranianIraqiIrishIroquoisIsraeliItalianJamaicanJapaneseJordanianKenyanKiowaKoreanLaotianLatvianLebaneseLiberianLithuanianLumbeeLuxembourgerMacedonianMalaysianMalteseMarshalleseMenomineeMexicanMexican American IndianMongolianMoroccanNative HawaiianNavajoNepaleseNew ZealanderNicaraguanNigerianNorthern EuropeanNorwegianOkinawanOsageOttawaPaiutePakistaniPalestinianPanamanianParaguayanPennsylvania GermanPeruvianPimaPolishPortuguesePotawatomiPuebloPuerto RicanPuget Sound SalishRomanianRussianSalvadoranSamoanScandinavianScotch-IrishScottishSeminoleSenegaleseSerbianShoshoneSierra LeoneanSiouxSlavicSlovakSloveneSomaliSouth AfricanSouth AmericanSouth American IndianSoviet UnionSpaniardSpanishSpanish AmericanSpanish American IndianSri LankanSubsaharan AfricanSudaneseSwedishSwissSyrianTaiwaneseThaiTlingit-HaidaTohono O'OdhamTonganTrinidadian and TobagonianTsimshianTurkishU.S. Virgin IslanderUgandanUkrainianUruguayanUteVenezuelanVietnameseWelshWest IndianYakamaYaquiYugoslavianYumanYup'ikZimbabwean
Immigration
NonimmigrantsImmigrantsAfghanistanAfricaAlbaniaArgentinaArmeniaAsiaAustraliaAustriaBahamasBangladeshBarbadosBelarusBelgiumBelizeBoliviaBosnia and HerzegovinaBrazilBulgariaBurma/MyanmarCabo VerdeCambodiaCameroonCanadaCentral AmericaChileChinaColombiaCongoCosta RicaCroatiaCubaCzechoslovakiaDenmarkDominicaDominican RepublicEastern AfricaEastern AsiaEastern EuropeEcuadorEgyptEl SalvadorEnglandEritreaEthiopiaEuropeFijiFranceGermanyGhanaGreeceGrenadaGuatemalaGuyanaHaitiHondurasHong KongHungaryIndiaIndonesiaIranIraqIrelandIsraelItalyJamaicaJapanJordanKazakhstanKenyaKoreaKuwaitLaosLatin AmericaLatviaLebanonLiberiaLithuaniaMalaysiaMexicoMicronesiaMiddle AfricaMoldovaMoroccoNepalNetherlandsNicaraguaNigeriaNorth AmericaNorth MacedoniaNorthern AfricaNorthern EuropeNorwayOceaniaPakistanPanamaPeruPhilippinesPolandPortugalRomaniaRussiaSaudi ArabiaScotlandSenegalSerbiaSierra LeoneSingaporeSomaliaSouth AfricaSouth AmericaSouth Central AsiaSouth Eastern AsiaSouthern EuropeSpainSri LankaSt. Vincent and the GrenadinesSudanSwedenSwitzerlandSyriaTaiwanThailandTrinidad and TobagoTurkeyUgandaUkraineUruguayUzbekistanVenezuelaVietnamWest IndiesWestern AfricaWestern AsiaWestern EuropeYemenZaireZimbabweAzores
Immigrants from Caribbean
Race
Ancestry
AfghanAfricanAlaska NativeAlaskan AthabascanAlbanianAleutAlsatianAmericanApacheArabArapahoArgentineanArmenianAssyrian/Chaldean/SyriacAustralianAustrianBahamianBangladeshiBarbadianBasqueBelgianBelizeanBermudanBhutaneseBlackfeetBolivianBrazilianBritishBritish West IndianBulgarianBurmeseCajunCambodianCanadianCape VerdeanCarpatho RusynCelticCentral AmericanCentral American IndianCherokeeCheyenneChickasawChileanChineseChippewaChoctawColombianColvilleComancheCosta RicanCreeCreekCroatianCrowCubanCypriotCzechCzechoslovakianDanishDelawareDominicanDutchDutch West IndianEastern EuropeanEcuadorianEgyptianEnglishEstonianEthiopianEuropeanFijianFilipinoFinnishFrenchFrench American IndianFrench CanadianGermanGerman RussianGhanaianGreekGuamanian/ChamorroGuatemalanGuyaneseHaitianHmongHonduranHopiHoumaHungarianIcelanderIndian (Asian)IndonesianInupiatIranianIraqiIrishIroquoisIsraeliItalianJamaicanJapaneseJordanianKenyanKiowaKoreanLaotianLatvianLebaneseLiberianLithuanianLumbeeLuxembourgerMacedonianMalaysianMalteseMarshalleseMenomineeMexicanMexican American IndianMongolianMoroccanNative HawaiianNavajoNepaleseNew ZealanderNicaraguanNigerianNorthern EuropeanNorwegianOkinawanOsageOttawaPaiutePakistaniPalestinianPanamanianParaguayanPennsylvania GermanPeruvianPimaPolishPortuguesePotawatomiPuebloPuerto RicanPuget Sound SalishRomanianRussianSalvadoranSamoanScandinavianScotch-IrishScottishSeminoleSenegaleseSerbianShoshoneSierra LeoneanSiouxSlavicSlovakSloveneSomaliSouth AfricanSouth AmericanSouth American IndianSoviet UnionSpaniardSpanishSpanish AmericanSpanish American IndianSri LankanSubsaharan AfricanSudaneseSwedishSwissSyrianTaiwaneseThaiTlingit-HaidaTohono O'OdhamTonganTrinidadian and TobagonianTsimshianTurkishU.S. Virgin IslanderUgandanUkrainianUruguayanUteVenezuelanVietnameseWelshWest IndianYakamaYaquiYugoslavianYumanYup'ikZimbabwean
Immigration
NonimmigrantsImmigrantsAfghanistanAfricaAlbaniaArgentinaArmeniaAsiaAustraliaAustriaBahamasBangladeshBarbadosBelarusBelgiumBelizeBoliviaBosnia and HerzegovinaBrazilBulgariaBurma/MyanmarCabo VerdeCambodiaCameroonCanadaCaribbeanCentral AmericaChileChinaColombiaCongoCosta RicaCroatiaCubaCzechoslovakiaDenmarkDominicaDominican RepublicEastern AfricaEastern AsiaEastern EuropeEcuadorEgyptEl SalvadorEnglandEritreaEthiopiaEuropeFijiFranceGermanyGhanaGreeceGrenadaGuatemalaGuyanaHaitiHondurasHong KongHungaryIndiaIndonesiaIranIraqIrelandIsraelItalyJamaicaJapanJordanKazakhstanKenyaKoreaKuwaitLaosLatin AmericaLatviaLebanonLiberiaMalaysiaMexicoMicronesiaMiddle AfricaMoldovaMoroccoNepalNetherlandsNicaraguaNigeriaNorth AmericaNorth MacedoniaNorthern AfricaNorthern EuropeNorwayOceaniaPakistanPanamaPeruPhilippinesPolandPortugalRomaniaRussiaSaudi ArabiaScotlandSenegalSerbiaSierra LeoneSingaporeSomaliaSouth AfricaSouth AmericaSouth Central AsiaSouth Eastern AsiaSouthern EuropeSpainSri LankaSt. Vincent and the GrenadinesSudanSwedenSwitzerlandSyriaTaiwanThailandTrinidad and TobagoTurkeyUgandaUkraineUruguayUzbekistanVenezuelaVietnamWest IndiesWestern AfricaWestern AsiaWestern EuropeYemenZaireZimbabweAzores
Currently Married
Income
Poverty
Unemployment
Labor Participation
Family Structure
Vehicle Availability
Education Level
Disability

Currently Married Comparison

Immigrants from Lithuania

Immigrants from Caribbean

Exceptional
Tragic
48.8%
CURRENTLY MARRIED
99.4/ 100
METRIC RATING
34th/ 347
METRIC RANK
41.3%
CURRENTLY MARRIED
0.0/ 100
METRIC RATING
316th/ 347
METRIC RANK

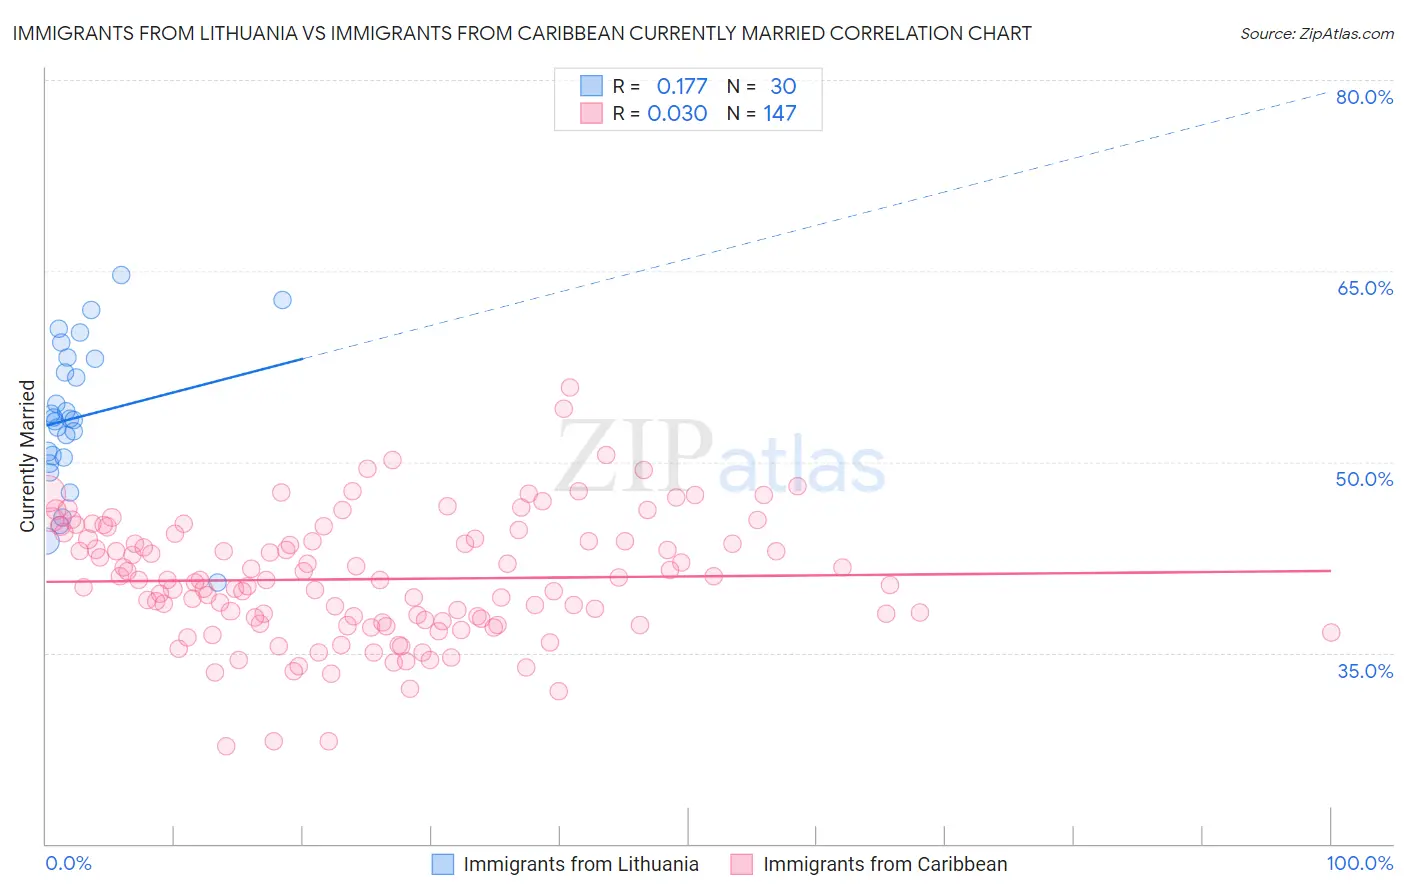
Immigrants from Lithuania vs Immigrants from Caribbean Currently Married Correlation Chart

The statistical analysis conducted on geographies consisting of 117,724,932 people shows a poor positive correlation between the proportion of Immigrants from Lithuania and percentage of population currently married in the United States with a correlation coefficient (R) of 0.177 and weighted average of 48.8%. Similarly, the statistical analysis conducted on geographies consisting of 450,001,379 people shows no correlation between the proportion of Immigrants from Caribbean and percentage of population currently married in the United States with a correlation coefficient (R) of 0.030 and weighted average of 41.3%, a difference of 18.4%.
Immigrants from Lithuania vs Immigrants from Caribbean Currently Married

Currently Married Correlation Summary

MeasurementImmigrants from LithuaniaImmigrants from Caribbean
Minimum40.5%27.6%
Maximum64.7%55.8%
Range24.2%28.2%
Mean53.5%40.8%
Median53.4%40.7%
Interquartile 25% (IQ1)50.4%37.3%
Interquartile 75% (IQ3)58.1%43.9%
Interquartile Range (IQR)7.8%6.6%
Standard Deviation (Sample)5.8%4.9%
Standard Deviation (Population)5.7%4.9%

Similar Demographics by Currently Married

Demographics Similar to Immigrants from Lithuania by Currently Married

In terms of currently married, the demographic groups most similar to Immigrants from Lithuania are Immigrants from Northern Europe (48.8%, a difference of 0.020%), Italian (48.8%, a difference of 0.030%), Hungarian (48.8%, a difference of 0.030%), Irish (48.9%, a difference of 0.060%), and Czechoslovakian (48.8%, a difference of 0.070%).
DemographicsRating | RankCurrently Married
Burmese
99.6
/100
|
#27
Exceptional
48.9%
Welsh
99.5
/100
|
#28
Exceptional
48.9%
Croatians
99.5
/100
|
#29
Exceptional
48.9%
Eastern Europeans
99.5
/100
|
#30
Exceptional
48.9%
Poles
99.5
/100
|
#31
Exceptional
48.9%
Immigrants | Hong Kong
99.5
/100
|
#32
Exceptional
48.9%
Irish
99.5
/100
|
#33
Exceptional
48.9%
Immigrants | Lithuania
99.4
/100
|
#34
Exceptional
48.8%
Immigrants | Northern Europe
99.4
/100
|
#35
Exceptional
48.8%
Italians
99.4
/100
|
#36
Exceptional
48.8%
Hungarians
99.4
/100
|
#37
Exceptional
48.8%
Czechoslovakians
99.4
/100
|
#38
Exceptional
48.8%
British
99.4
/100
|
#39
Exceptional
48.8%
Immigrants | Canada
99.4
/100
|
#40
Exceptional
48.8%
Greeks
99.3
/100
|
#41
Exceptional
48.8%

Demographics Similar to Immigrants from Caribbean by Currently Married

In terms of currently married, the demographic groups most similar to Immigrants from Caribbean are Haitian (41.3%, a difference of 0.020%), Inupiat (41.3%, a difference of 0.060%), West Indian (41.3%, a difference of 0.15%), Bahamian (41.2%, a difference of 0.20%), and Jamaican (41.4%, a difference of 0.22%).
DemographicsRating | RankCurrently Married
Immigrants | Liberia
0.0
/100
|
#309
Tragic
41.8%
Guyanese
0.0
/100
|
#310
Tragic
41.6%
Trinidadians and Tobagonians
0.0
/100
|
#311
Tragic
41.5%
Somalis
0.0
/100
|
#312
Tragic
41.5%
Jamaicans
0.0
/100
|
#313
Tragic
41.4%
West Indians
0.0
/100
|
#314
Tragic
41.3%
Inupiat
0.0
/100
|
#315
Tragic
41.3%
Immigrants | Caribbean
0.0
/100
|
#316
Tragic
41.3%
Haitians
0.0
/100
|
#317
Tragic
41.3%
Bahamians
0.0
/100
|
#318
Tragic
41.2%
Immigrants | Somalia
0.0
/100
|
#319
Tragic
41.2%
Immigrants | Jamaica
0.0
/100
|
#320
Tragic
41.1%
Immigrants | Congo
0.0
/100
|
#321
Tragic
41.1%
Immigrants | Haiti
0.0
/100
|
#322
Tragic
41.0%
Immigrants | West Indies
0.0
/100
|
#323
Tragic
40.7%