Immigrants from Saudi Arabia vs German Russian Currently Married
COMPARE
Immigrants from Saudi Arabia
German Russian
Currently Married
Currently Married Comparison
Immigrants from Saudi Arabia
German Russians
44.7%
CURRENTLY MARRIED
1.1/ 100
METRIC RATING
233rd/ 347
METRIC RANK
45.5%
CURRENTLY MARRIED
6.7/ 100
METRIC RATING
215th/ 347
METRIC RANK
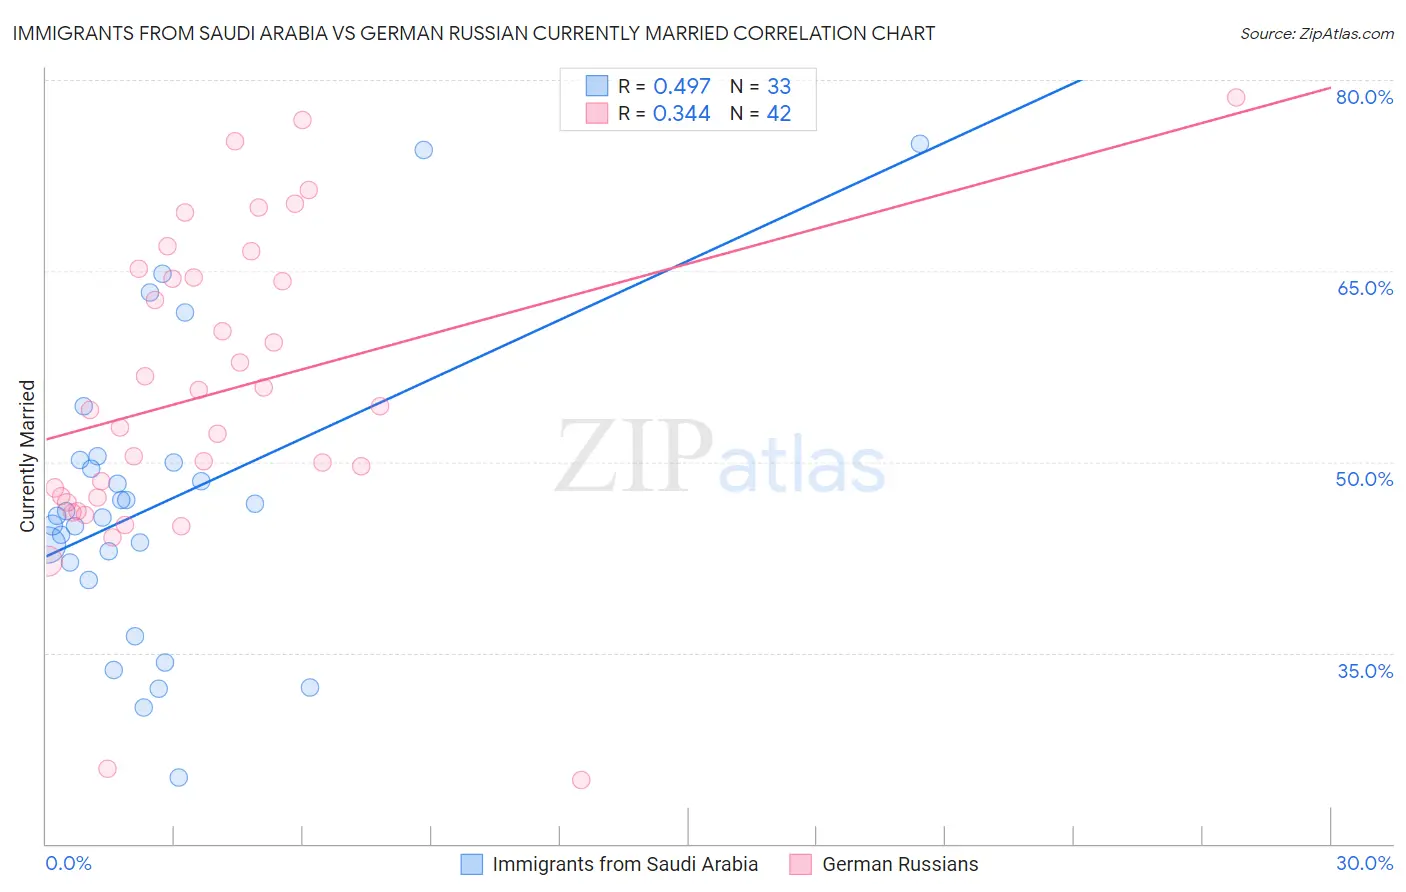
Immigrants from Saudi Arabia vs German Russian Currently Married Correlation Chart
The statistical analysis conducted on geographies consisting of 164,277,877 people shows a moderate positive correlation between the proportion of Immigrants from Saudi Arabia and percentage of population currently married in the United States with a correlation coefficient (R) of 0.497 and weighted average of 44.7%. Similarly, the statistical analysis conducted on geographies consisting of 96,455,839 people shows a mild positive correlation between the proportion of German Russians and percentage of population currently married in the United States with a correlation coefficient (R) of 0.344 and weighted average of 45.5%, a difference of 1.8%.
Currently Married Correlation Summary
| Measurement | Immigrants from Saudi Arabia | German Russian |
| Minimum | 25.2% | 25.0% |
| Maximum | 75.0% | 78.6% |
| Range | 49.8% | 53.6% |
| Mean | 46.7% | 55.4% |
| Median | 45.8% | 54.2% |
| Interquartile 25% (IQ1) | 41.4% | 47.2% |
| Interquartile 75% (IQ3) | 50.1% | 64.5% |
| Interquartile Range (IQR) | 8.7% | 17.3% |
| Standard Deviation (Sample) | 11.4% | 12.1% |
| Standard Deviation (Population) | 11.3% | 12.0% |
Demographics Similar to Immigrants from Saudi Arabia and German Russians by Currently Married
In terms of currently married, the demographic groups most similar to Immigrants from Saudi Arabia are Iroquois (44.7%, a difference of 0.010%), Nepalese (44.7%, a difference of 0.050%), Immigrants from Panama (44.9%, a difference of 0.31%), Immigrants from Kenya (44.9%, a difference of 0.35%), and Cree (44.9%, a difference of 0.39%). Similarly, the demographic groups most similar to German Russians are Dutch West Indian (45.5%, a difference of 0.0%), Immigrants from Morocco (45.4%, a difference of 0.20%), Immigrants from Thailand (45.4%, a difference of 0.28%), Panamanian (45.3%, a difference of 0.52%), and Immigrants from Portugal (45.2%, a difference of 0.64%).
| Demographics | Rating | Rank | Currently Married |
| Dutch West Indians | 6.7 /100 | #214 | Tragic 45.5% |
| German Russians | 6.7 /100 | #215 | Tragic 45.5% |
| Immigrants | Morocco | 5.5 /100 | #216 | Tragic 45.4% |
| Immigrants | Thailand | 5.1 /100 | #217 | Tragic 45.4% |
| Panamanians | 4.0 /100 | #218 | Tragic 45.3% |
| Immigrants | Portugal | 3.5 /100 | #219 | Tragic 45.2% |
| Kenyans | 3.1 /100 | #220 | Tragic 45.2% |
| Mexicans | 3.0 /100 | #221 | Tragic 45.2% |
| Immigrants | Azores | 2.5 /100 | #222 | Tragic 45.1% |
| Immigrants | Laos | 2.3 /100 | #223 | Tragic 45.0% |
| Immigrants | Uganda | 2.2 /100 | #224 | Tragic 45.0% |
| French American Indians | 2.2 /100 | #225 | Tragic 45.0% |
| Comanche | 2.1 /100 | #226 | Tragic 45.0% |
| Spanish Americans | 2.1 /100 | #227 | Tragic 45.0% |
| Immigrants | Uruguay | 2.0 /100 | #228 | Tragic 45.0% |
| Cree | 1.7 /100 | #229 | Tragic 44.9% |
| Immigrants | Kenya | 1.6 /100 | #230 | Tragic 44.9% |
| Immigrants | Panama | 1.5 /100 | #231 | Tragic 44.9% |
| Nepalese | 1.2 /100 | #232 | Tragic 44.7% |
| Immigrants | Saudi Arabia | 1.1 /100 | #233 | Tragic 44.7% |
| Iroquois | 1.1 /100 | #234 | Tragic 44.7% |