Immigrants from Asia vs German Russian Currently Married
COMPARE
Immigrants from Asia
German Russian
Currently Married
Currently Married Comparison
Immigrants from Asia
German Russians
48.3%
CURRENTLY MARRIED
97.9/ 100
METRIC RATING
70th/ 347
METRIC RANK
45.5%
CURRENTLY MARRIED
6.7/ 100
METRIC RATING
215th/ 347
METRIC RANK
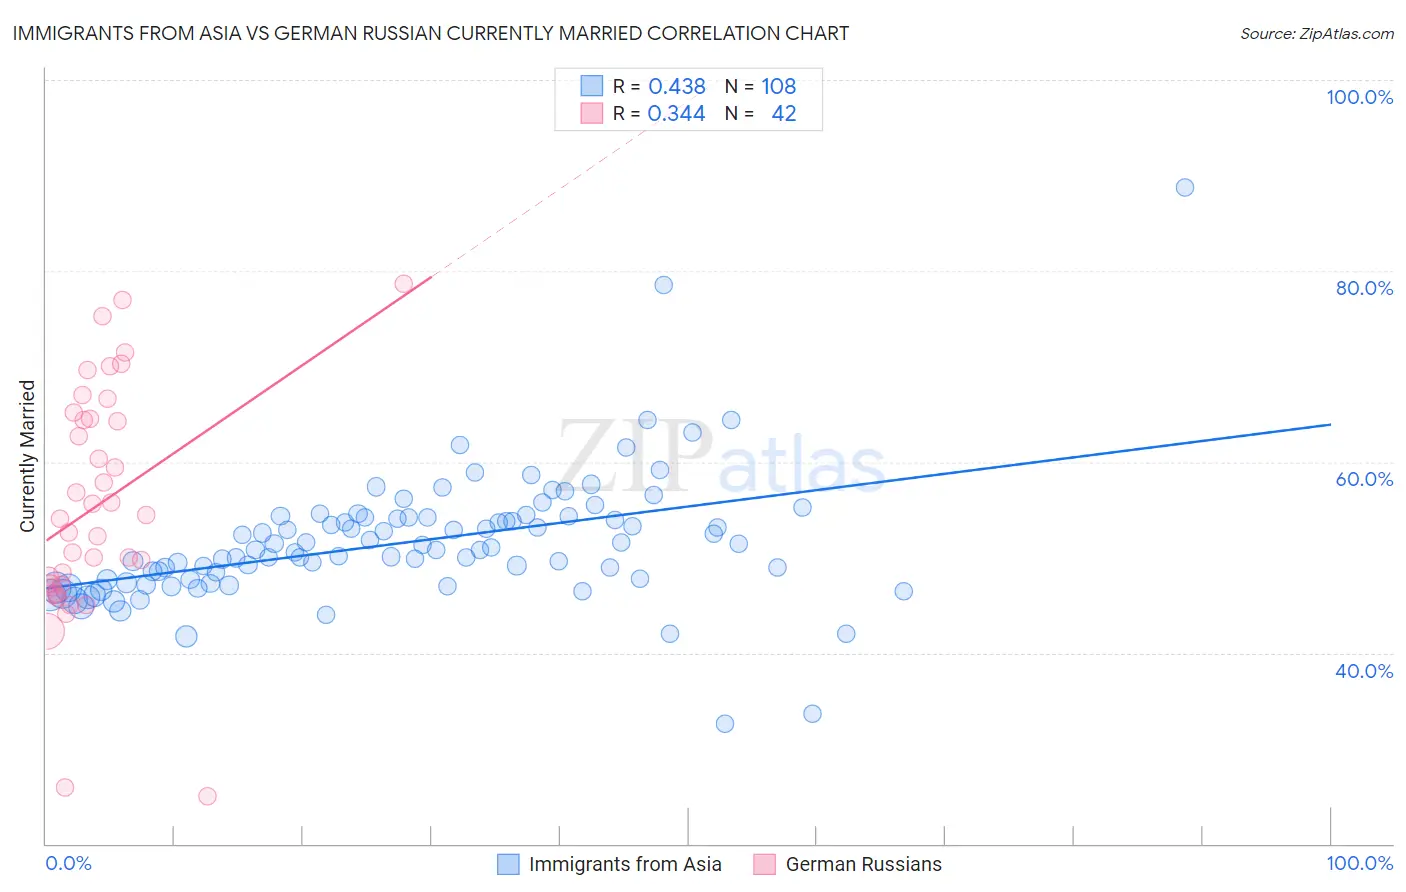
Immigrants from Asia vs German Russian Currently Married Correlation Chart
The statistical analysis conducted on geographies consisting of 549,041,877 people shows a moderate positive correlation between the proportion of Immigrants from Asia and percentage of population currently married in the United States with a correlation coefficient (R) of 0.438 and weighted average of 48.3%. Similarly, the statistical analysis conducted on geographies consisting of 96,455,839 people shows a mild positive correlation between the proportion of German Russians and percentage of population currently married in the United States with a correlation coefficient (R) of 0.344 and weighted average of 45.5%, a difference of 6.1%.
Currently Married Correlation Summary
| Measurement | Immigrants from Asia | German Russian |
| Minimum | 32.6% | 25.0% |
| Maximum | 88.7% | 78.6% |
| Range | 56.1% | 53.6% |
| Mean | 51.6% | 55.4% |
| Median | 50.8% | 54.2% |
| Interquartile 25% (IQ1) | 47.5% | 47.2% |
| Interquartile 75% (IQ3) | 54.2% | 64.5% |
| Interquartile Range (IQR) | 6.7% | 17.3% |
| Standard Deviation (Sample) | 6.9% | 12.1% |
| Standard Deviation (Population) | 6.9% | 12.0% |
Similar Demographics by Currently Married
Demographics Similar to Immigrants from Asia by Currently Married
In terms of currently married, the demographic groups most similar to Immigrants from Asia are Macedonian (48.3%, a difference of 0.010%), Canadian (48.3%, a difference of 0.090%), Immigrants from England (48.3%, a difference of 0.10%), Slovak (48.3%, a difference of 0.11%), and Tongan (48.3%, a difference of 0.12%).
| Demographics | Rating | Rank | Currently Married |
| Slavs | 98.3 /100 | #63 | Exceptional 48.4% |
| Immigrants | Czechoslovakia | 98.3 /100 | #64 | Exceptional 48.4% |
| Ukrainians | 98.3 /100 | #65 | Exceptional 48.4% |
| Tongans | 98.2 /100 | #66 | Exceptional 48.3% |
| Slovaks | 98.2 /100 | #67 | Exceptional 48.3% |
| Immigrants | England | 98.2 /100 | #68 | Exceptional 48.3% |
| Canadians | 98.1 /100 | #69 | Exceptional 48.3% |
| Immigrants | Asia | 97.9 /100 | #70 | Exceptional 48.3% |
| Macedonians | 97.9 /100 | #71 | Exceptional 48.3% |
| Immigrants | Lebanon | 97.6 /100 | #72 | Exceptional 48.2% |
| Immigrants | Eastern Asia | 97.5 /100 | #73 | Exceptional 48.2% |
| Estonians | 97.4 /100 | #74 | Exceptional 48.2% |
| Immigrants | Belarus | 97.2 /100 | #75 | Exceptional 48.1% |
| Basques | 97.2 /100 | #76 | Exceptional 48.1% |
| Slovenes | 97.1 /100 | #77 | Exceptional 48.1% |
Demographics Similar to German Russians by Currently Married
In terms of currently married, the demographic groups most similar to German Russians are Dutch West Indian (45.5%, a difference of 0.0%), Alaska Native (45.5%, a difference of 0.040%), Marshallese (45.5%, a difference of 0.070%), Houma (45.5%, a difference of 0.080%), and Uruguayan (45.6%, a difference of 0.16%).
| Demographics | Rating | Rank | Currently Married |
| Alsatians | 10.8 /100 | #208 | Poor 45.7% |
| Immigrants | Micronesia | 8.8 /100 | #209 | Tragic 45.6% |
| Uruguayans | 7.9 /100 | #210 | Tragic 45.6% |
| Houma | 7.2 /100 | #211 | Tragic 45.5% |
| Marshallese | 7.2 /100 | #212 | Tragic 45.5% |
| Alaska Natives | 7.0 /100 | #213 | Tragic 45.5% |
| Dutch West Indians | 6.7 /100 | #214 | Tragic 45.5% |
| German Russians | 6.7 /100 | #215 | Tragic 45.5% |
| Immigrants | Morocco | 5.5 /100 | #216 | Tragic 45.4% |
| Immigrants | Thailand | 5.1 /100 | #217 | Tragic 45.4% |
| Panamanians | 4.0 /100 | #218 | Tragic 45.3% |
| Immigrants | Portugal | 3.5 /100 | #219 | Tragic 45.2% |
| Kenyans | 3.1 /100 | #220 | Tragic 45.2% |
| Mexicans | 3.0 /100 | #221 | Tragic 45.2% |
| Immigrants | Azores | 2.5 /100 | #222 | Tragic 45.1% |