Immigrants from Russia vs Immigrants from Eritrea Single Mother Households
COMPARE
Immigrants from Russia
Immigrants from Eritrea
Single Mother Households
Single Mother Households Comparison
Immigrants from Russia
Immigrants from Eritrea
5.5%
SINGLE MOTHER HOUSEHOLDS
99.1/ 100
METRIC RATING
53rd/ 347
METRIC RANK
6.7%
SINGLE MOTHER HOUSEHOLDS
8.4/ 100
METRIC RATING
212th/ 347
METRIC RANK
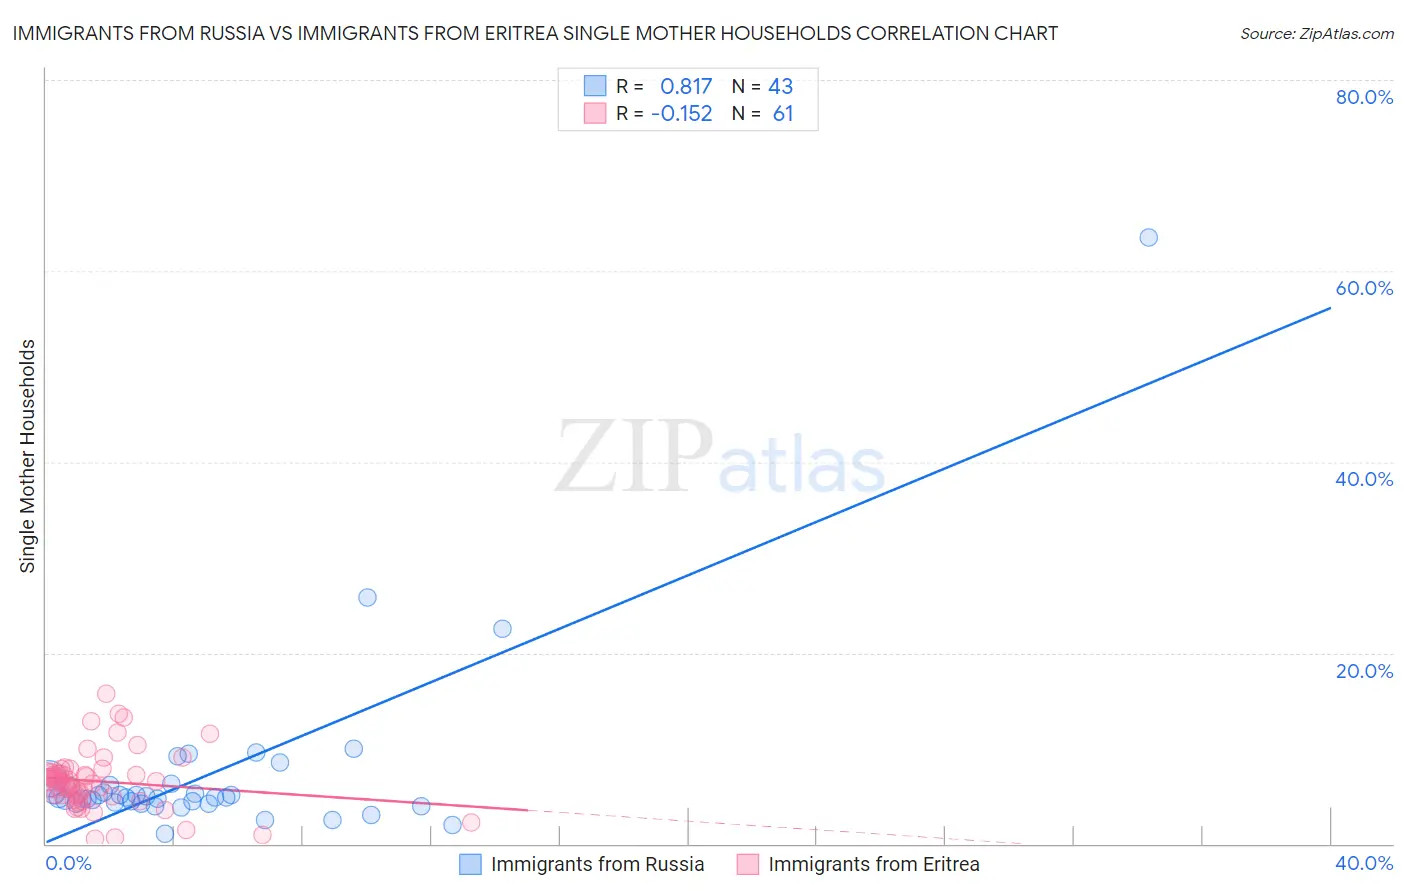
Immigrants from Russia vs Immigrants from Eritrea Single Mother Households Correlation Chart
The statistical analysis conducted on geographies consisting of 346,998,386 people shows a very strong positive correlation between the proportion of Immigrants from Russia and percentage of single mother households in the United States with a correlation coefficient (R) of 0.817 and weighted average of 5.5%. Similarly, the statistical analysis conducted on geographies consisting of 104,781,978 people shows a poor negative correlation between the proportion of Immigrants from Eritrea and percentage of single mother households in the United States with a correlation coefficient (R) of -0.152 and weighted average of 6.7%, a difference of 22.3%.
Single Mother Households Correlation Summary
| Measurement | Immigrants from Russia | Immigrants from Eritrea |
| Minimum | 1.1% | 0.57% |
| Maximum | 63.5% | 15.7% |
| Range | 62.4% | 15.2% |
| Mean | 7.3% | 6.5% |
| Median | 4.9% | 6.5% |
| Interquartile 25% (IQ1) | 4.3% | 5.0% |
| Interquartile 75% (IQ3) | 6.2% | 7.4% |
| Interquartile Range (IQR) | 1.9% | 2.4% |
| Standard Deviation (Sample) | 9.9% | 3.0% |
| Standard Deviation (Population) | 9.7% | 3.0% |
Similar Demographics by Single Mother Households
Demographics Similar to Immigrants from Russia by Single Mother Households
In terms of single mother households, the demographic groups most similar to Immigrants from Russia are Immigrants from Lebanon (5.5%, a difference of 0.020%), Swedish (5.5%, a difference of 0.10%), Immigrants from Belarus (5.5%, a difference of 0.17%), Immigrants from Scotland (5.5%, a difference of 0.18%), and Immigrants from Denmark (5.5%, a difference of 0.19%).
| Demographics | Rating | Rank | Single Mother Households |
| Croatians | 99.3 /100 | #46 | Exceptional 5.5% |
| Norwegians | 99.3 /100 | #47 | Exceptional 5.5% |
| Turks | 99.2 /100 | #48 | Exceptional 5.5% |
| Immigrants | Latvia | 99.2 /100 | #49 | Exceptional 5.5% |
| Immigrants | Scotland | 99.2 /100 | #50 | Exceptional 5.5% |
| Immigrants | Belarus | 99.2 /100 | #51 | Exceptional 5.5% |
| Swedes | 99.1 /100 | #52 | Exceptional 5.5% |
| Immigrants | Russia | 99.1 /100 | #53 | Exceptional 5.5% |
| Immigrants | Lebanon | 99.1 /100 | #54 | Exceptional 5.5% |
| Immigrants | Denmark | 99.1 /100 | #55 | Exceptional 5.5% |
| Immigrants | Romania | 99.0 /100 | #56 | Exceptional 5.5% |
| Immigrants | Europe | 99.0 /100 | #57 | Exceptional 5.5% |
| Danes | 98.9 /100 | #58 | Exceptional 5.5% |
| Luxembourgers | 98.7 /100 | #59 | Exceptional 5.6% |
| Immigrants | Norway | 98.7 /100 | #60 | Exceptional 5.6% |
Demographics Similar to Immigrants from Eritrea by Single Mother Households
In terms of single mother households, the demographic groups most similar to Immigrants from Eritrea are Immigrants from Venezuela (6.7%, a difference of 0.050%), Immigrants from Costa Rica (6.7%, a difference of 0.050%), Immigrants from Uruguay (6.7%, a difference of 0.16%), Nonimmigrants (6.7%, a difference of 0.63%), and Immigrants from Colombia (6.7%, a difference of 0.65%).
| Demographics | Rating | Rank | Single Mother Households |
| Cree | 11.9 /100 | #205 | Poor 6.7% |
| German Russians | 11.5 /100 | #206 | Poor 6.7% |
| Immigrants | South America | 11.5 /100 | #207 | Poor 6.7% |
| Vietnamese | 11.3 /100 | #208 | Poor 6.7% |
| Immigrants | Colombia | 10.5 /100 | #209 | Poor 6.7% |
| Immigrants | Nonimmigrants | 10.4 /100 | #210 | Poor 6.7% |
| Immigrants | Venezuela | 8.5 /100 | #211 | Tragic 6.7% |
| Immigrants | Eritrea | 8.4 /100 | #212 | Tragic 6.7% |
| Immigrants | Costa Rica | 8.2 /100 | #213 | Tragic 6.7% |
| Immigrants | Uruguay | 7.9 /100 | #214 | Tragic 6.7% |
| Shoshone | 5.7 /100 | #215 | Tragic 6.8% |
| Cherokee | 5.1 /100 | #216 | Tragic 6.8% |
| Aleuts | 4.8 /100 | #217 | Tragic 6.8% |
| Immigrants | Eastern Africa | 4.4 /100 | #218 | Tragic 6.8% |
| Immigrants | Immigrants | 4.3 /100 | #219 | Tragic 6.8% |