Immigrants from Russia vs Chinese Single Mother Households
COMPARE
Immigrants from Russia
Chinese
Single Mother Households
Single Mother Households Comparison
Immigrants from Russia
Chinese
5.5%
SINGLE MOTHER HOUSEHOLDS
99.1/ 100
METRIC RATING
53rd/ 347
METRIC RANK
5.2%
SINGLE MOTHER HOUSEHOLDS
99.9/ 100
METRIC RATING
19th/ 347
METRIC RANK
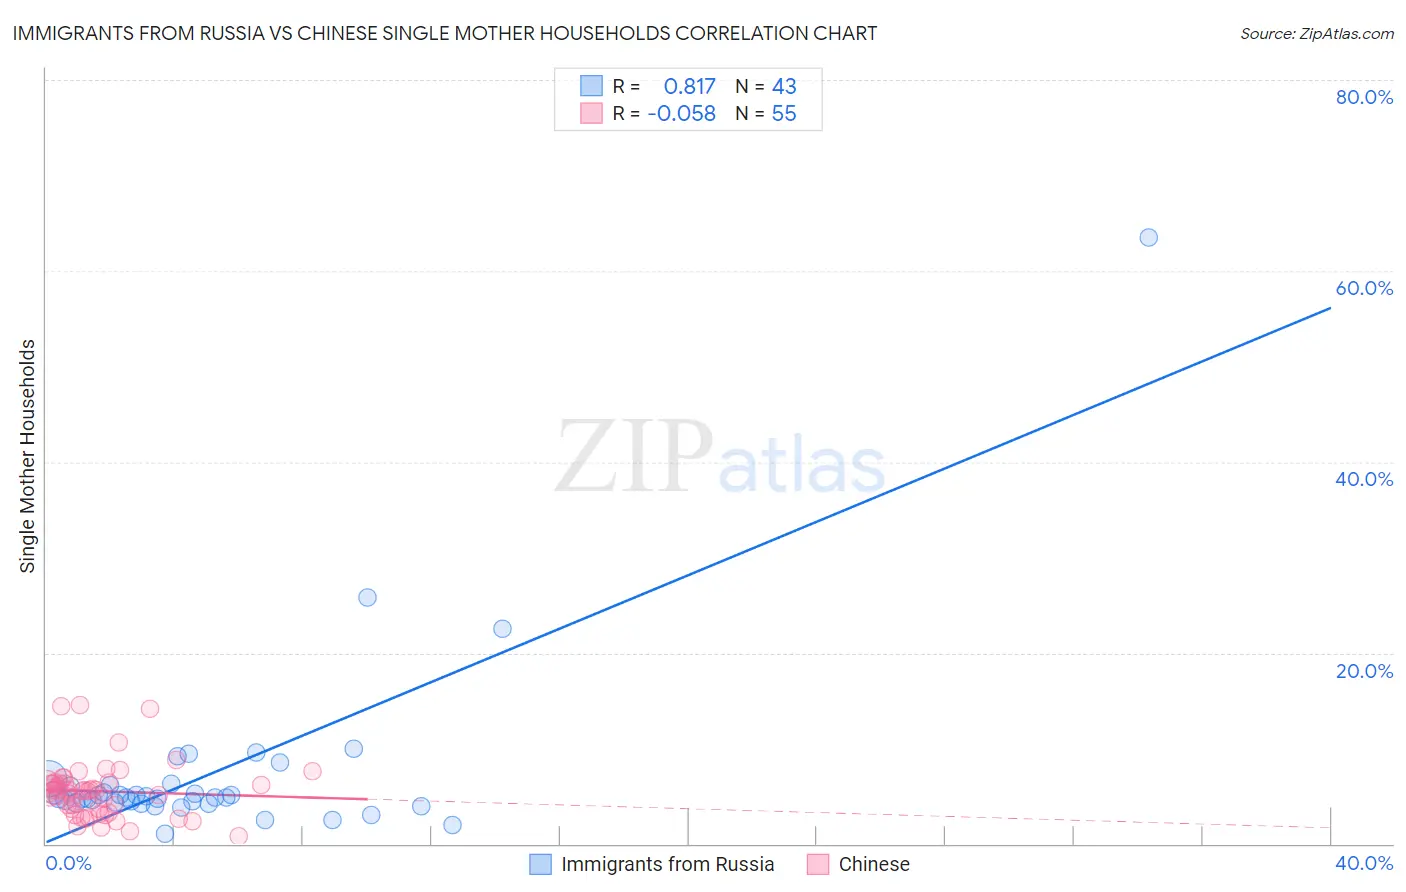
Immigrants from Russia vs Chinese Single Mother Households Correlation Chart
The statistical analysis conducted on geographies consisting of 346,998,386 people shows a very strong positive correlation between the proportion of Immigrants from Russia and percentage of single mother households in the United States with a correlation coefficient (R) of 0.817 and weighted average of 5.5%. Similarly, the statistical analysis conducted on geographies consisting of 64,782,861 people shows a slight negative correlation between the proportion of Chinese and percentage of single mother households in the United States with a correlation coefficient (R) of -0.058 and weighted average of 5.2%, a difference of 6.5%.
Single Mother Households Correlation Summary
| Measurement | Immigrants from Russia | Chinese |
| Minimum | 1.1% | 0.78% |
| Maximum | 63.5% | 14.6% |
| Range | 62.4% | 13.8% |
| Mean | 7.3% | 5.5% |
| Median | 4.9% | 5.5% |
| Interquartile 25% (IQ1) | 4.3% | 3.3% |
| Interquartile 75% (IQ3) | 6.2% | 6.4% |
| Interquartile Range (IQR) | 1.9% | 3.1% |
| Standard Deviation (Sample) | 9.9% | 2.9% |
| Standard Deviation (Population) | 9.7% | 2.9% |
Similar Demographics by Single Mother Households
Demographics Similar to Immigrants from Russia by Single Mother Households
In terms of single mother households, the demographic groups most similar to Immigrants from Russia are Immigrants from Lebanon (5.5%, a difference of 0.020%), Swedish (5.5%, a difference of 0.10%), Immigrants from Belarus (5.5%, a difference of 0.17%), Immigrants from Scotland (5.5%, a difference of 0.18%), and Immigrants from Denmark (5.5%, a difference of 0.19%).
| Demographics | Rating | Rank | Single Mother Households |
| Croatians | 99.3 /100 | #46 | Exceptional 5.5% |
| Norwegians | 99.3 /100 | #47 | Exceptional 5.5% |
| Turks | 99.2 /100 | #48 | Exceptional 5.5% |
| Immigrants | Latvia | 99.2 /100 | #49 | Exceptional 5.5% |
| Immigrants | Scotland | 99.2 /100 | #50 | Exceptional 5.5% |
| Immigrants | Belarus | 99.2 /100 | #51 | Exceptional 5.5% |
| Swedes | 99.1 /100 | #52 | Exceptional 5.5% |
| Immigrants | Russia | 99.1 /100 | #53 | Exceptional 5.5% |
| Immigrants | Lebanon | 99.1 /100 | #54 | Exceptional 5.5% |
| Immigrants | Denmark | 99.1 /100 | #55 | Exceptional 5.5% |
| Immigrants | Romania | 99.0 /100 | #56 | Exceptional 5.5% |
| Immigrants | Europe | 99.0 /100 | #57 | Exceptional 5.5% |
| Danes | 98.9 /100 | #58 | Exceptional 5.5% |
| Luxembourgers | 98.7 /100 | #59 | Exceptional 5.6% |
| Immigrants | Norway | 98.7 /100 | #60 | Exceptional 5.6% |
Demographics Similar to Chinese by Single Mother Households
In terms of single mother households, the demographic groups most similar to Chinese are Immigrants from Armenia (5.2%, a difference of 0.11%), Maltese (5.2%, a difference of 0.47%), Eastern European (5.2%, a difference of 0.53%), Soviet Union (5.1%, a difference of 0.88%), and Indian (Asian) (5.1%, a difference of 1.1%).
| Demographics | Rating | Rank | Single Mother Households |
| Cypriots | 99.9 /100 | #12 | Exceptional 5.1% |
| Immigrants | India | 99.9 /100 | #13 | Exceptional 5.1% |
| Immigrants | Australia | 99.9 /100 | #14 | Exceptional 5.1% |
| Immigrants | Eastern Asia | 99.9 /100 | #15 | Exceptional 5.1% |
| Indians (Asian) | 99.9 /100 | #16 | Exceptional 5.1% |
| Soviet Union | 99.9 /100 | #17 | Exceptional 5.1% |
| Immigrants | Armenia | 99.9 /100 | #18 | Exceptional 5.2% |
| Chinese | 99.9 /100 | #19 | Exceptional 5.2% |
| Maltese | 99.9 /100 | #20 | Exceptional 5.2% |
| Eastern Europeans | 99.8 /100 | #21 | Exceptional 5.2% |
| Thais | 99.8 /100 | #22 | Exceptional 5.2% |
| Immigrants | Austria | 99.8 /100 | #23 | Exceptional 5.2% |
| Armenians | 99.8 /100 | #24 | Exceptional 5.2% |
| Immigrants | Japan | 99.8 /100 | #25 | Exceptional 5.2% |
| Immigrants | Lithuania | 99.8 /100 | #26 | Exceptional 5.3% |