Immigrants from Moldova vs Crow Divorced or Separated
COMPARE
Immigrants from Moldova
Crow
Divorced or Separated
Divorced or Separated Comparison
Immigrants from Moldova
Crow
12.1%
DIVORCED OR SEPARATED
50.4/ 100
METRIC RATING
173rd/ 347
METRIC RANK
14.1%
DIVORCED OR SEPARATED
0.0/ 100
METRIC RATING
337th/ 347
METRIC RANK
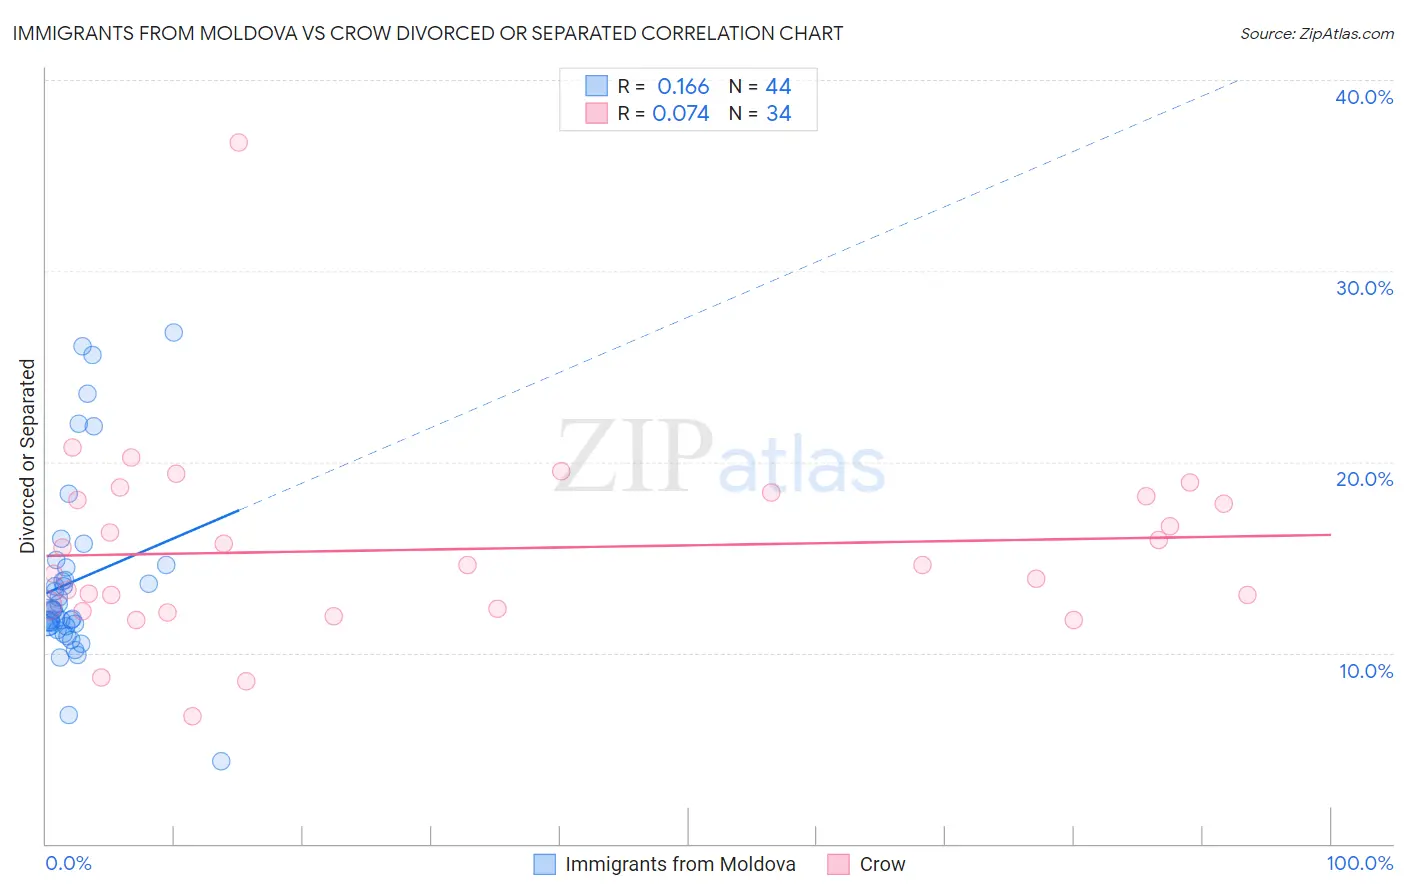
Immigrants from Moldova vs Crow Divorced or Separated Correlation Chart
The statistical analysis conducted on geographies consisting of 124,391,086 people shows a poor positive correlation between the proportion of Immigrants from Moldova and percentage of population currently divorced or separated in the United States with a correlation coefficient (R) of 0.166 and weighted average of 12.1%. Similarly, the statistical analysis conducted on geographies consisting of 59,208,993 people shows a slight positive correlation between the proportion of Crow and percentage of population currently divorced or separated in the United States with a correlation coefficient (R) of 0.074 and weighted average of 14.1%, a difference of 16.8%.
Divorced or Separated Correlation Summary
| Measurement | Immigrants from Moldova | Crow |
| Minimum | 4.3% | 6.7% |
| Maximum | 26.8% | 36.7% |
| Range | 22.5% | 30.0% |
| Mean | 13.8% | 15.4% |
| Median | 12.2% | 14.6% |
| Interquartile 25% (IQ1) | 11.4% | 12.3% |
| Interquartile 75% (IQ3) | 14.5% | 18.2% |
| Interquartile Range (IQR) | 3.2% | 5.9% |
| Standard Deviation (Sample) | 4.8% | 5.1% |
| Standard Deviation (Population) | 4.8% | 5.1% |
Similar Demographics by Divorced or Separated
Demographics Similar to Immigrants from Moldova by Divorced or Separated
In terms of divorced or separated, the demographic groups most similar to Immigrants from Moldova are Hawaiian (12.1%, a difference of 0.020%), Immigrants from Sierra Leone (12.1%, a difference of 0.020%), Pennsylvania German (12.1%, a difference of 0.050%), Immigrants from Mexico (12.0%, a difference of 0.090%), and Brazilian (12.1%, a difference of 0.090%).
| Demographics | Rating | Rank | Divorced or Separated |
| Tohono O'odham | 60.4 /100 | #166 | Good 12.0% |
| Ethiopians | 58.5 /100 | #167 | Average 12.0% |
| Serbians | 57.1 /100 | #168 | Average 12.0% |
| Immigrants | Peru | 57.0 /100 | #169 | Average 12.0% |
| Mexican American Indians | 55.8 /100 | #170 | Average 12.0% |
| Costa Ricans | 53.3 /100 | #171 | Average 12.0% |
| Immigrants | Mexico | 53.2 /100 | #172 | Average 12.0% |
| Immigrants | Moldova | 50.4 /100 | #173 | Average 12.1% |
| Hawaiians | 50.0 /100 | #174 | Average 12.1% |
| Immigrants | Sierra Leone | 50.0 /100 | #175 | Average 12.1% |
| Pennsylvania Germans | 48.9 /100 | #176 | Average 12.1% |
| Brazilians | 47.7 /100 | #177 | Average 12.1% |
| Ghanaians | 45.9 /100 | #178 | Average 12.1% |
| Immigrants | Western Europe | 45.6 /100 | #179 | Average 12.1% |
| Barbadians | 45.0 /100 | #180 | Average 12.1% |
Demographics Similar to Crow by Divorced or Separated
In terms of divorced or separated, the demographic groups most similar to Crow are Shoshone (14.0%, a difference of 0.28%), Choctaw (14.1%, a difference of 0.31%), Dutch West Indian (14.0%, a difference of 0.63%), Colville (14.2%, a difference of 0.84%), and Chickasaw (14.2%, a difference of 0.88%).
| Demographics | Rating | Rank | Divorced or Separated |
| Paiute | 0.0 /100 | #330 | Tragic 13.6% |
| Blacks/African Americans | 0.0 /100 | #331 | Tragic 13.6% |
| Cherokee | 0.0 /100 | #332 | Tragic 13.7% |
| Puerto Ricans | 0.0 /100 | #333 | Tragic 13.9% |
| Immigrants | Bahamas | 0.0 /100 | #334 | Tragic 13.9% |
| Dutch West Indians | 0.0 /100 | #335 | Tragic 14.0% |
| Shoshone | 0.0 /100 | #336 | Tragic 14.0% |
| Crow | 0.0 /100 | #337 | Tragic 14.1% |
| Choctaw | 0.0 /100 | #338 | Tragic 14.1% |
| Colville | 0.0 /100 | #339 | Tragic 14.2% |
| Chickasaw | 0.0 /100 | #340 | Tragic 14.2% |
| Bahamians | 0.0 /100 | #341 | Tragic 14.2% |
| Seminole | 0.0 /100 | #342 | Tragic 14.3% |
| Creek | 0.0 /100 | #343 | Tragic 14.4% |
| Cubans | 0.0 /100 | #344 | Tragic 14.5% |