Immigrants from Liberia vs Immigrants from Greece Average Family Size
COMPARE
Immigrants from Liberia
Immigrants from Greece
Average Family Size
Average Family Size Comparison
Immigrants from Liberia
Immigrants from Greece
3.27
AVERAGE FAMILY SIZE
95.0/ 100
METRIC RATING
115th/ 347
METRIC RANK
3.16
AVERAGE FAMILY SIZE
0.9/ 100
METRIC RATING
266th/ 347
METRIC RANK
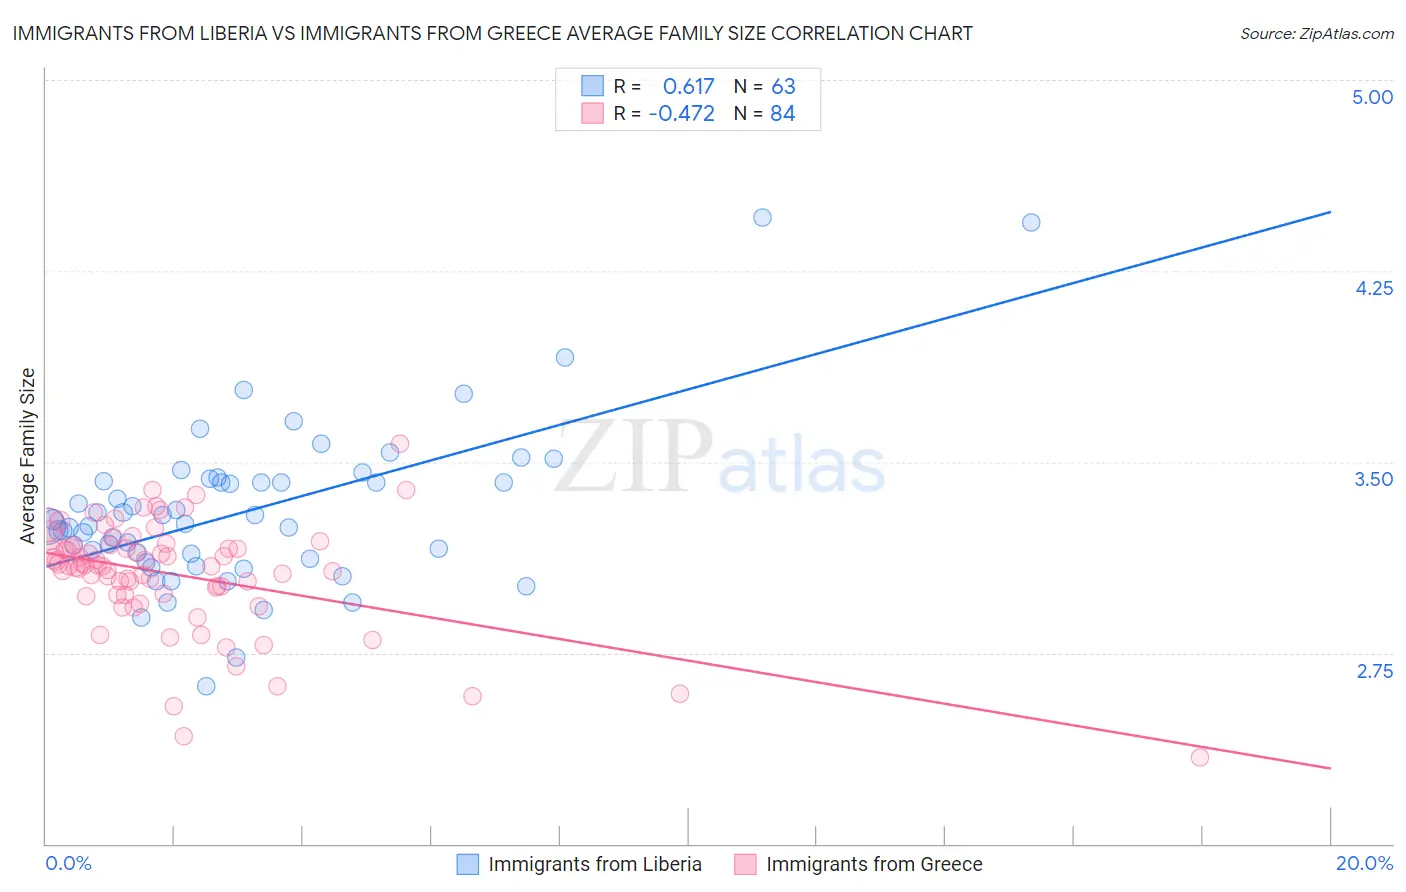
Immigrants from Liberia vs Immigrants from Greece Average Family Size Correlation Chart
The statistical analysis conducted on geographies consisting of 135,241,796 people shows a significant positive correlation between the proportion of Immigrants from Liberia and average family size in the United States with a correlation coefficient (R) of 0.617 and weighted average of 3.27. Similarly, the statistical analysis conducted on geographies consisting of 216,856,630 people shows a moderate negative correlation between the proportion of Immigrants from Greece and average family size in the United States with a correlation coefficient (R) of -0.472 and weighted average of 3.16, a difference of 3.6%.
Average Family Size Correlation Summary
| Measurement | Immigrants from Liberia | Immigrants from Greece |
| Minimum | 2.62 | 2.34 |
| Maximum | 4.46 | 3.57 |
| Range | 1.84 | 1.23 |
| Mean | 3.31 | 3.06 |
| Median | 3.26 | 3.09 |
| Interquartile 25% (IQ1) | 3.12 | 2.98 |
| Interquartile 75% (IQ3) | 3.42 | 3.17 |
| Interquartile Range (IQR) | 0.30 | 0.19 |
| Standard Deviation (Sample) | 0.32 | 0.22 |
| Standard Deviation (Population) | 0.31 | 0.21 |
Similar Demographics by Average Family Size
Demographics Similar to Immigrants from Liberia by Average Family Size
In terms of average family size, the demographic groups most similar to Immigrants from Liberia are Immigrants from South America (3.27, a difference of 0.0%), South American (3.27, a difference of 0.010%), Kiowa (3.27, a difference of 0.020%), Immigrants from Panama (3.27, a difference of 0.060%), and Black/African American (3.27, a difference of 0.070%).
| Demographics | Rating | Rank | Average Family Size |
| Asians | 97.0 /100 | #108 | Exceptional 3.28 |
| Puerto Ricans | 96.7 /100 | #109 | Exceptional 3.28 |
| Bahamians | 96.6 /100 | #110 | Exceptional 3.28 |
| Indonesians | 96.2 /100 | #111 | Exceptional 3.28 |
| Blacks/African Americans | 95.7 /100 | #112 | Exceptional 3.27 |
| Immigrants | Panama | 95.6 /100 | #113 | Exceptional 3.27 |
| South Americans | 95.1 /100 | #114 | Exceptional 3.27 |
| Immigrants | Liberia | 95.0 /100 | #115 | Exceptional 3.27 |
| Immigrants | South America | 95.0 /100 | #116 | Exceptional 3.27 |
| Kiowa | 94.8 /100 | #117 | Exceptional 3.27 |
| Immigrants | Asia | 94.0 /100 | #118 | Exceptional 3.27 |
| Immigrants | Indonesia | 93.7 /100 | #119 | Exceptional 3.27 |
| Immigrants | Bahamas | 93.6 /100 | #120 | Exceptional 3.27 |
| Immigrants | Thailand | 93.3 /100 | #121 | Exceptional 3.27 |
| Immigrants | Colombia | 92.8 /100 | #122 | Exceptional 3.27 |
Demographics Similar to Immigrants from Greece by Average Family Size
In terms of average family size, the demographic groups most similar to Immigrants from Greece are Immigrants from South Africa (3.16, a difference of 0.010%), Iroquois (3.16, a difference of 0.020%), American (3.16, a difference of 0.060%), Maltese (3.16, a difference of 0.060%), and Immigrants from Singapore (3.16, a difference of 0.070%).
| Demographics | Rating | Rank | Average Family Size |
| Potawatomi | 1.3 /100 | #259 | Tragic 3.16 |
| Immigrants | Albania | 1.3 /100 | #260 | Tragic 3.16 |
| Immigrants | North Macedonia | 1.3 /100 | #261 | Tragic 3.16 |
| Immigrants | Russia | 1.3 /100 | #262 | Tragic 3.16 |
| Immigrants | Bulgaria | 1.0 /100 | #263 | Tragic 3.16 |
| Americans | 1.0 /100 | #264 | Tragic 3.16 |
| Immigrants | South Africa | 0.9 /100 | #265 | Tragic 3.16 |
| Immigrants | Greece | 0.9 /100 | #266 | Tragic 3.16 |
| Iroquois | 0.8 /100 | #267 | Tragic 3.16 |
| Maltese | 0.8 /100 | #268 | Tragic 3.16 |
| Immigrants | Singapore | 0.7 /100 | #269 | Tragic 3.16 |
| Tlingit-Haida | 0.7 /100 | #270 | Tragic 3.16 |
| Immigrants | Germany | 0.7 /100 | #271 | Tragic 3.15 |
| Immigrants | Lithuania | 0.6 /100 | #272 | Tragic 3.15 |
| New Zealanders | 0.6 /100 | #273 | Tragic 3.15 |