Immigrants from Latin America vs Hawaiian Family Households with Children
COMPARE
Immigrants from Latin America
Hawaiian
Family Households with Children
Family Households with Children Comparison
Immigrants from Latin America
Hawaiians
29.7%
FAMILY HOUSEHOLDS WITH CHILDREN
100.0/ 100
METRIC RATING
25th/ 347
METRIC RANK
28.7%
FAMILY HOUSEHOLDS WITH CHILDREN
100.0/ 100
METRIC RATING
58th/ 347
METRIC RANK
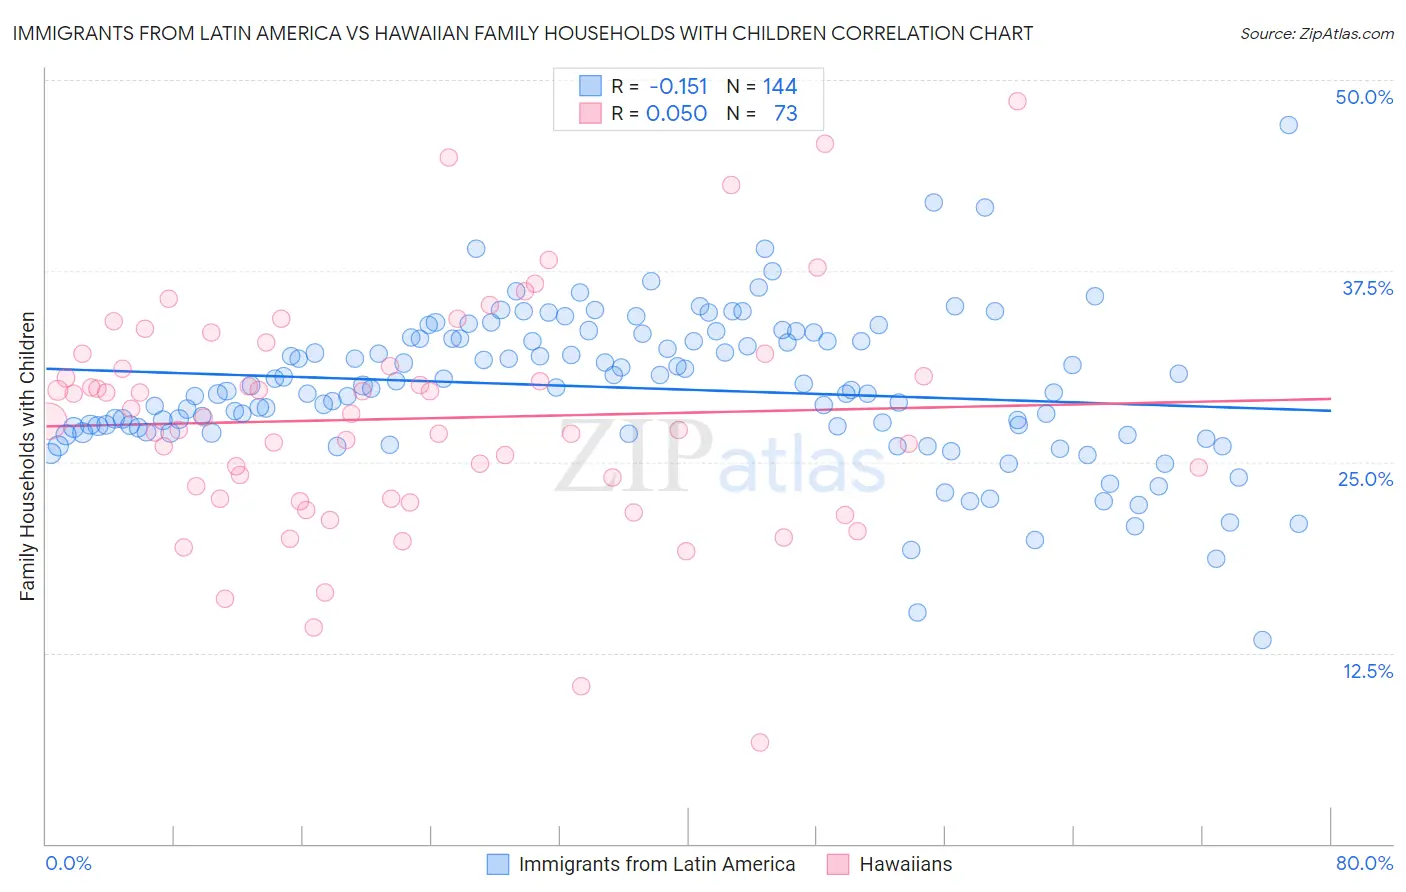
Immigrants from Latin America vs Hawaiian Family Households with Children Correlation Chart
The statistical analysis conducted on geographies consisting of 557,667,257 people shows a poor negative correlation between the proportion of Immigrants from Latin America and percentage of family households with children in the United States with a correlation coefficient (R) of -0.151 and weighted average of 29.7%. Similarly, the statistical analysis conducted on geographies consisting of 327,312,465 people shows no correlation between the proportion of Hawaiians and percentage of family households with children in the United States with a correlation coefficient (R) of 0.050 and weighted average of 28.7%, a difference of 3.4%.
Family Households with Children Correlation Summary
| Measurement | Immigrants from Latin America | Hawaiian |
| Minimum | 13.3% | 6.7% |
| Maximum | 47.1% | 48.6% |
| Range | 33.7% | 41.9% |
| Mean | 29.8% | 27.8% |
| Median | 29.8% | 27.9% |
| Interquartile 25% (IQ1) | 27.1% | 22.6% |
| Interquartile 75% (IQ3) | 33.1% | 31.6% |
| Interquartile Range (IQR) | 6.0% | 9.1% |
| Standard Deviation (Sample) | 4.9% | 7.5% |
| Standard Deviation (Population) | 4.9% | 7.5% |
Similar Demographics by Family Households with Children
Demographics Similar to Immigrants from Latin America by Family Households with Children
In terms of family households with children, the demographic groups most similar to Immigrants from Latin America are Guamanian/Chamorro (29.7%, a difference of 0.10%), Mexican American Indian (29.7%, a difference of 0.20%), Sri Lankan (29.5%, a difference of 0.44%), Malaysian (29.8%, a difference of 0.47%), and Immigrants from Vietnam (29.5%, a difference of 0.47%).
| Demographics | Rating | Rank | Family Households with Children |
| Salvadorans | 100.0 /100 | #18 | Exceptional 29.9% |
| Alaska Natives | 100.0 /100 | #19 | Exceptional 29.9% |
| Immigrants | El Salvador | 100.0 /100 | #20 | Exceptional 29.8% |
| Immigrants | Laos | 100.0 /100 | #21 | Exceptional 29.8% |
| Malaysians | 100.0 /100 | #22 | Exceptional 29.8% |
| Mexican American Indians | 100.0 /100 | #23 | Exceptional 29.7% |
| Guamanians/Chamorros | 100.0 /100 | #24 | Exceptional 29.7% |
| Immigrants | Latin America | 100.0 /100 | #25 | Exceptional 29.7% |
| Sri Lankans | 100.0 /100 | #26 | Exceptional 29.5% |
| Immigrants | Vietnam | 100.0 /100 | #27 | Exceptional 29.5% |
| Samoans | 100.0 /100 | #28 | Exceptional 29.5% |
| Bolivians | 100.0 /100 | #29 | Exceptional 29.5% |
| Yuman | 100.0 /100 | #30 | Exceptional 29.5% |
| Japanese | 100.0 /100 | #31 | Exceptional 29.4% |
| Immigrants | Yemen | 100.0 /100 | #32 | Exceptional 29.4% |
Demographics Similar to Hawaiians by Family Households with Children
In terms of family households with children, the demographic groups most similar to Hawaiians are Danish (28.7%, a difference of 0.15%), Immigrants from Nigeria (28.6%, a difference of 0.33%), Immigrants from Guatemala (28.8%, a difference of 0.39%), Hmong (28.6%, a difference of 0.39%), and Immigrants from Asia (28.8%, a difference of 0.46%).
| Demographics | Rating | Rank | Family Households with Children |
| Immigrants | Peru | 100.0 /100 | #51 | Exceptional 28.9% |
| Guatemalans | 100.0 /100 | #52 | Exceptional 28.9% |
| Immigrants | Cambodia | 100.0 /100 | #53 | Exceptional 28.9% |
| Sierra Leoneans | 100.0 /100 | #54 | Exceptional 28.9% |
| Immigrants | Asia | 100.0 /100 | #55 | Exceptional 28.8% |
| Immigrants | Guatemala | 100.0 /100 | #56 | Exceptional 28.8% |
| Danes | 100.0 /100 | #57 | Exceptional 28.7% |
| Hawaiians | 100.0 /100 | #58 | Exceptional 28.7% |
| Immigrants | Nigeria | 100.0 /100 | #59 | Exceptional 28.6% |
| Hmong | 99.9 /100 | #60 | Exceptional 28.6% |
| Immigrants | Ghana | 99.9 /100 | #61 | Exceptional 28.6% |
| Egyptians | 99.9 /100 | #62 | Exceptional 28.6% |
| Immigrants | Lebanon | 99.9 /100 | #63 | Exceptional 28.6% |
| Filipinos | 99.9 /100 | #64 | Exceptional 28.6% |
| Hondurans | 99.9 /100 | #65 | Exceptional 28.5% |