Immigrants from Hungary vs Bulgarian Single Father Households
COMPARE
Immigrants from Hungary
Bulgarian
Single Father Households
Single Father Households Comparison
Immigrants from Hungary
Bulgarians
2.1%
SINGLE FATHER HOUSEHOLDS
99.6/ 100
METRIC RATING
85th/ 347
METRIC RANK
2.0%
SINGLE FATHER HOUSEHOLDS
100.0/ 100
METRIC RATING
29th/ 347
METRIC RANK
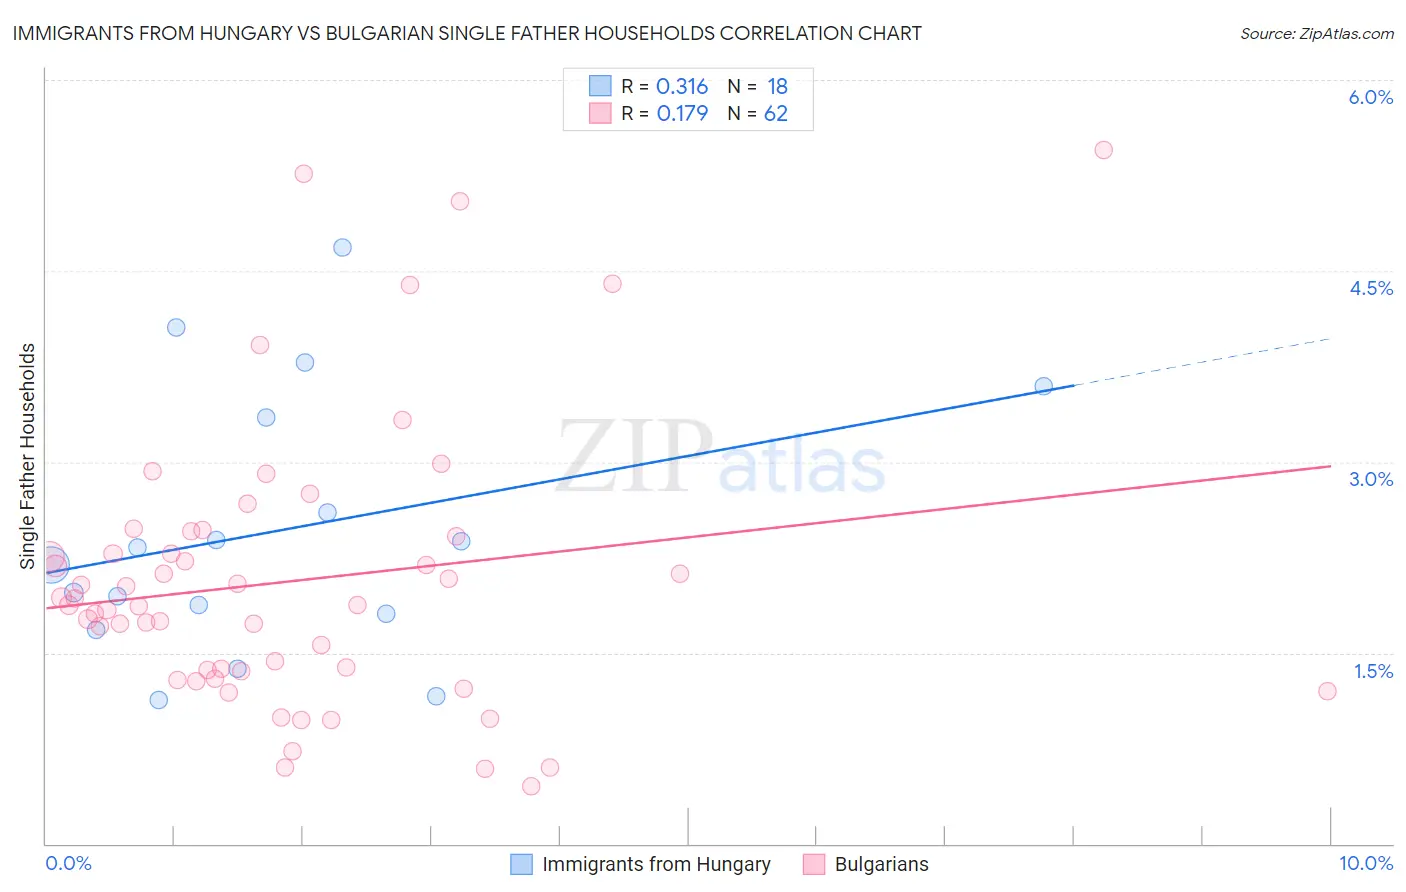
Immigrants from Hungary vs Bulgarian Single Father Households Correlation Chart
The statistical analysis conducted on geographies consisting of 194,547,582 people shows a mild positive correlation between the proportion of Immigrants from Hungary and percentage of single father households in the United States with a correlation coefficient (R) of 0.316 and weighted average of 2.1%. Similarly, the statistical analysis conducted on geographies consisting of 204,652,646 people shows a poor positive correlation between the proportion of Bulgarians and percentage of single father households in the United States with a correlation coefficient (R) of 0.179 and weighted average of 2.0%, a difference of 6.5%.
Single Father Households Correlation Summary
| Measurement | Immigrants from Hungary | Bulgarian |
| Minimum | 1.1% | 0.45% |
| Maximum | 4.7% | 5.5% |
| Range | 3.6% | 5.0% |
| Mean | 2.5% | 2.1% |
| Median | 2.3% | 1.9% |
| Interquartile 25% (IQ1) | 1.8% | 1.4% |
| Interquartile 75% (IQ3) | 3.3% | 2.4% |
| Interquartile Range (IQR) | 1.5% | 1.1% |
| Standard Deviation (Sample) | 1.0% | 1.1% |
| Standard Deviation (Population) | 1.00% | 1.1% |
Similar Demographics by Single Father Households
Demographics Similar to Immigrants from Hungary by Single Father Households
In terms of single father households, the demographic groups most similar to Immigrants from Hungary are Carpatho Rusyn (2.1%, a difference of 0.040%), Asian (2.1%, a difference of 0.080%), Greek (2.1%, a difference of 0.34%), New Zealander (2.1%, a difference of 0.35%), and Armenian (2.1%, a difference of 0.40%).
| Demographics | Rating | Rank | Single Father Households |
| Estonians | 99.7 /100 | #78 | Exceptional 2.1% |
| Immigrants | Asia | 99.7 /100 | #79 | Exceptional 2.1% |
| Immigrants | South Africa | 99.7 /100 | #80 | Exceptional 2.1% |
| Armenians | 99.7 /100 | #81 | Exceptional 2.1% |
| New Zealanders | 99.7 /100 | #82 | Exceptional 2.1% |
| Greeks | 99.7 /100 | #83 | Exceptional 2.1% |
| Carpatho Rusyns | 99.6 /100 | #84 | Exceptional 2.1% |
| Immigrants | Hungary | 99.6 /100 | #85 | Exceptional 2.1% |
| Asians | 99.6 /100 | #86 | Exceptional 2.1% |
| Lithuanians | 99.5 /100 | #87 | Exceptional 2.1% |
| Bhutanese | 99.5 /100 | #88 | Exceptional 2.1% |
| Immigrants | Armenia | 99.5 /100 | #89 | Exceptional 2.1% |
| Immigrants | Pakistan | 99.5 /100 | #90 | Exceptional 2.1% |
| Immigrants | Guyana | 99.4 /100 | #91 | Exceptional 2.1% |
| Romanians | 99.4 /100 | #92 | Exceptional 2.1% |
Demographics Similar to Bulgarians by Single Father Households
In terms of single father households, the demographic groups most similar to Bulgarians are Cambodian (2.0%, a difference of 0.020%), Israeli (2.0%, a difference of 0.050%), Immigrants from Japan (2.0%, a difference of 0.090%), Chinese (2.0%, a difference of 0.090%), and Immigrants from South Central Asia (2.0%, a difference of 0.27%).
| Demographics | Rating | Rank | Single Father Households |
| Immigrants | Latvia | 100.0 /100 | #22 | Exceptional 1.9% |
| Immigrants | Croatia | 100.0 /100 | #23 | Exceptional 2.0% |
| Immigrants | Russia | 100.0 /100 | #24 | Exceptional 2.0% |
| Eastern Europeans | 100.0 /100 | #25 | Exceptional 2.0% |
| Assyrians/Chaldeans/Syriacs | 100.0 /100 | #26 | Exceptional 2.0% |
| Immigrants | South Central Asia | 100.0 /100 | #27 | Exceptional 2.0% |
| Immigrants | Japan | 100.0 /100 | #28 | Exceptional 2.0% |
| Bulgarians | 100.0 /100 | #29 | Exceptional 2.0% |
| Cambodians | 100.0 /100 | #30 | Exceptional 2.0% |
| Israelis | 100.0 /100 | #31 | Exceptional 2.0% |
| Chinese | 100.0 /100 | #32 | Exceptional 2.0% |
| Turks | 100.0 /100 | #33 | Exceptional 2.0% |
| Immigrants | Australia | 100.0 /100 | #34 | Exceptional 2.0% |
| Albanians | 100.0 /100 | #35 | Exceptional 2.0% |
| Immigrants | Belgium | 100.0 /100 | #36 | Exceptional 2.0% |