Immigrants from Honduras vs Immigrants from Nicaragua Single Father Households
COMPARE
Immigrants from Honduras
Immigrants from Nicaragua
Single Father Households
Single Father Households Comparison
Immigrants from Honduras
Immigrants from Nicaragua
2.8%
SINGLE FATHER HOUSEHOLDS
0.0/ 100
METRIC RATING
303rd/ 347
METRIC RANK
2.7%
SINGLE FATHER HOUSEHOLDS
0.1/ 100
METRIC RATING
283rd/ 347
METRIC RANK
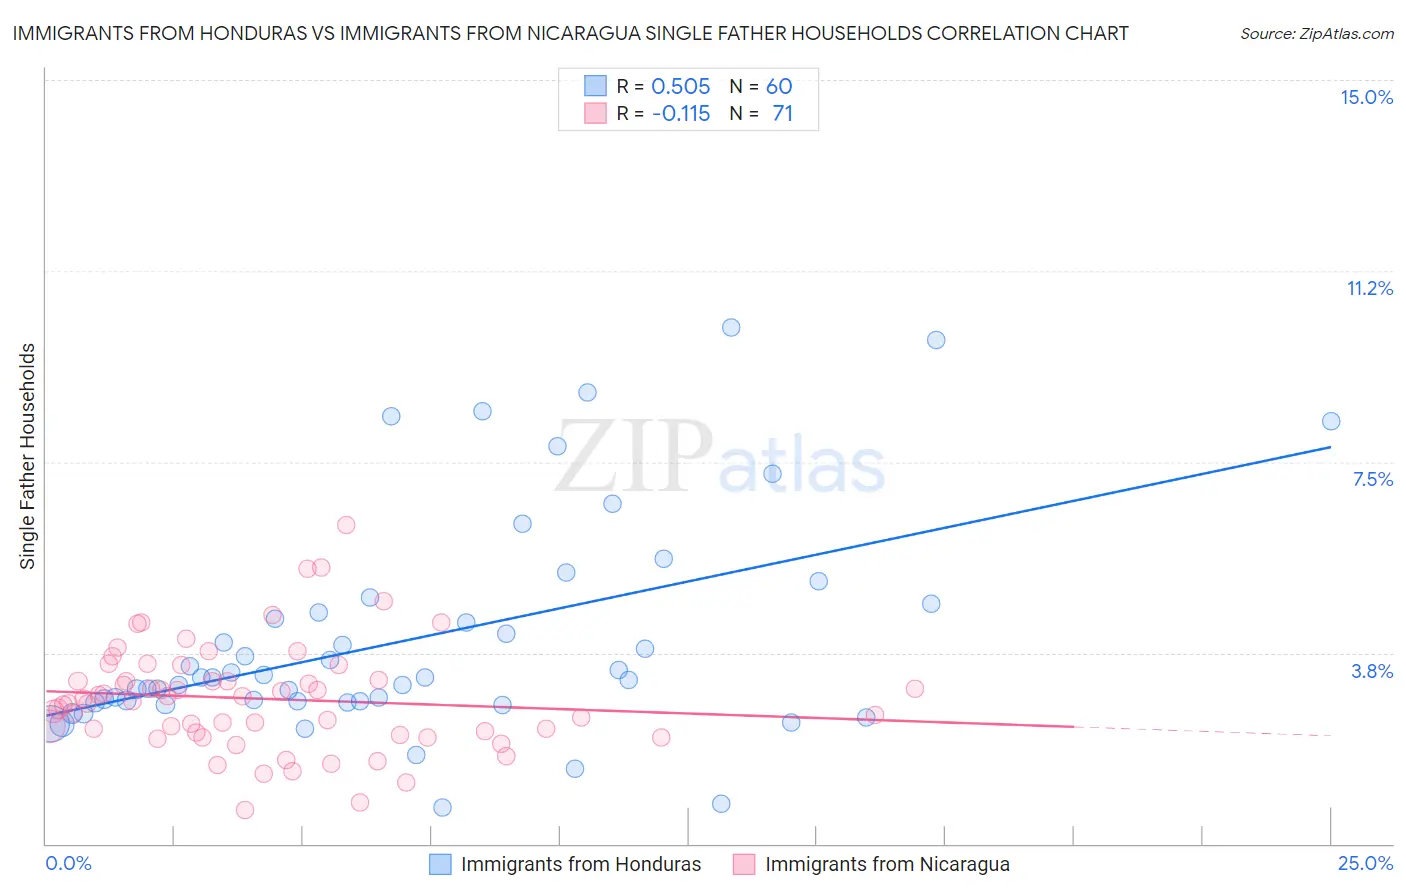
Immigrants from Honduras vs Immigrants from Nicaragua Single Father Households Correlation Chart
The statistical analysis conducted on geographies consisting of 320,953,127 people shows a substantial positive correlation between the proportion of Immigrants from Honduras and percentage of single father households in the United States with a correlation coefficient (R) of 0.505 and weighted average of 2.8%. Similarly, the statistical analysis conducted on geographies consisting of 235,741,591 people shows a poor negative correlation between the proportion of Immigrants from Nicaragua and percentage of single father households in the United States with a correlation coefficient (R) of -0.115 and weighted average of 2.7%, a difference of 5.6%.
Single Father Households Correlation Summary
| Measurement | Immigrants from Honduras | Immigrants from Nicaragua |
| Minimum | 0.70% | 0.67% |
| Maximum | 10.1% | 6.2% |
| Range | 9.4% | 5.6% |
| Mean | 4.0% | 2.8% |
| Median | 3.3% | 2.8% |
| Interquartile 25% (IQ1) | 2.8% | 2.2% |
| Interquartile 75% (IQ3) | 4.6% | 3.2% |
| Interquartile Range (IQR) | 1.9% | 1.0% |
| Standard Deviation (Sample) | 2.2% | 1.0% |
| Standard Deviation (Population) | 2.1% | 1.0% |
Demographics Similar to Immigrants from Honduras and Immigrants from Nicaragua by Single Father Households
In terms of single father households, the demographic groups most similar to Immigrants from Honduras are Spanish American (2.8%, a difference of 0.020%), Immigrants from Latin America (2.8%, a difference of 0.55%), Kiowa (2.8%, a difference of 0.60%), Lumbee (2.8%, a difference of 1.0%), and Cree (2.8%, a difference of 1.4%). Similarly, the demographic groups most similar to Immigrants from Nicaragua are Hawaiian (2.7%, a difference of 0.050%), Ottawa (2.7%, a difference of 0.14%), Immigrants from Cuba (2.7%, a difference of 0.15%), Central American Indian (2.7%, a difference of 0.31%), and Immigrants from Cambodia (2.7%, a difference of 0.56%).
| Demographics | Rating | Rank | Single Father Households |
| Immigrants | Nicaragua | 0.1 /100 | #283 | Tragic 2.7% |
| Hawaiians | 0.1 /100 | #284 | Tragic 2.7% |
| Ottawa | 0.1 /100 | #285 | Tragic 2.7% |
| Immigrants | Cuba | 0.1 /100 | #286 | Tragic 2.7% |
| Central American Indians | 0.0 /100 | #287 | Tragic 2.7% |
| Immigrants | Cambodia | 0.0 /100 | #288 | Tragic 2.7% |
| Tlingit-Haida | 0.0 /100 | #289 | Tragic 2.7% |
| Puget Sound Salish | 0.0 /100 | #290 | Tragic 2.7% |
| Blackfeet | 0.0 /100 | #291 | Tragic 2.7% |
| Choctaw | 0.0 /100 | #292 | Tragic 2.7% |
| Immigrants | Fiji | 0.0 /100 | #293 | Tragic 2.7% |
| Malaysians | 0.0 /100 | #294 | Tragic 2.7% |
| Chickasaw | 0.0 /100 | #295 | Tragic 2.8% |
| Japanese | 0.0 /100 | #296 | Tragic 2.8% |
| Hondurans | 0.0 /100 | #297 | Tragic 2.8% |
| Cree | 0.0 /100 | #298 | Tragic 2.8% |
| Lumbee | 0.0 /100 | #299 | Tragic 2.8% |
| Kiowa | 0.0 /100 | #300 | Tragic 2.8% |
| Immigrants | Latin America | 0.0 /100 | #301 | Tragic 2.8% |
| Spanish Americans | 0.0 /100 | #302 | Tragic 2.8% |
| Immigrants | Honduras | 0.0 /100 | #303 | Tragic 2.8% |