Immigrants from Grenada vs African Family Households
COMPARE
Immigrants from Grenada
African
Family Households
Family Households Comparison
Immigrants from Grenada
Africans
62.6%
FAMILY HOUSEHOLDS
0.0/ 100
METRIC RATING
290th/ 347
METRIC RANK
62.1%
FAMILY HOUSEHOLDS
0.0/ 100
METRIC RATING
306th/ 347
METRIC RANK
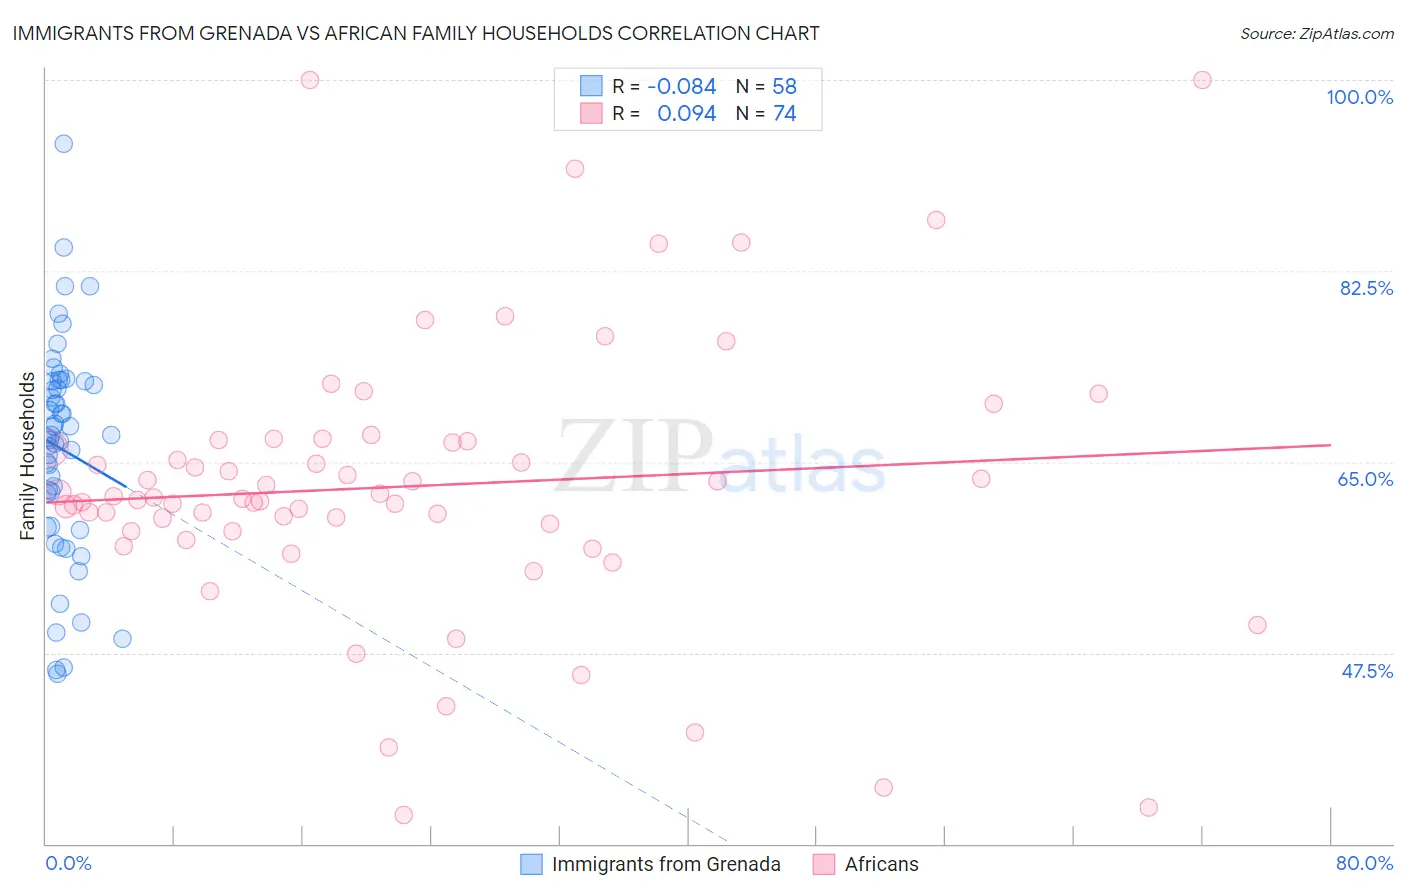
Immigrants from Grenada vs African Family Households Correlation Chart
The statistical analysis conducted on geographies consisting of 67,190,411 people shows a slight negative correlation between the proportion of Immigrants from Grenada and percentage of family households in the United States with a correlation coefficient (R) of -0.084 and weighted average of 62.6%. Similarly, the statistical analysis conducted on geographies consisting of 469,598,671 people shows a slight positive correlation between the proportion of Africans and percentage of family households in the United States with a correlation coefficient (R) of 0.094 and weighted average of 62.1%, a difference of 0.82%.
Family Households Correlation Summary
| Measurement | Immigrants from Grenada | African |
| Minimum | 45.6% | 32.6% |
| Maximum | 94.1% | 100.0% |
| Range | 48.5% | 67.4% |
| Mean | 66.2% | 62.8% |
| Median | 67.3% | 61.7% |
| Interquartile 25% (IQ1) | 59.1% | 58.7% |
| Interquartile 75% (IQ3) | 72.4% | 66.9% |
| Interquartile Range (IQR) | 13.3% | 8.2% |
| Standard Deviation (Sample) | 9.8% | 12.7% |
| Standard Deviation (Population) | 9.7% | 12.7% |
Demographics Similar to Immigrants from Grenada and Africans by Family Households
In terms of family households, the demographic groups most similar to Immigrants from Grenada are U.S. Virgin Islander (62.6%, a difference of 0.050%), Immigrants from Nepal (62.7%, a difference of 0.080%), Immigrants from Burma/Myanmar (62.6%, a difference of 0.10%), Immigrants from Uganda (62.7%, a difference of 0.17%), and Immigrants from Sweden (62.5%, a difference of 0.23%). Similarly, the demographic groups most similar to Africans are Bermudan (62.2%, a difference of 0.020%), Immigrants from Norway (62.1%, a difference of 0.080%), Chippewa (62.1%, a difference of 0.080%), Iroquois (62.2%, a difference of 0.17%), and Cree (62.3%, a difference of 0.27%).
| Demographics | Rating | Rank | Family Households |
| Immigrants | Uganda | 0.1 /100 | #288 | Tragic 62.7% |
| Immigrants | Nepal | 0.1 /100 | #289 | Tragic 62.7% |
| Immigrants | Grenada | 0.0 /100 | #290 | Tragic 62.6% |
| U.S. Virgin Islanders | 0.0 /100 | #291 | Tragic 62.6% |
| Immigrants | Burma/Myanmar | 0.0 /100 | #292 | Tragic 62.6% |
| Immigrants | Sweden | 0.0 /100 | #293 | Tragic 62.5% |
| Barbadians | 0.0 /100 | #294 | Tragic 62.5% |
| Okinawans | 0.0 /100 | #295 | Tragic 62.5% |
| Slovenes | 0.0 /100 | #296 | Tragic 62.4% |
| French American Indians | 0.0 /100 | #297 | Tragic 62.4% |
| Immigrants | Spain | 0.0 /100 | #298 | Tragic 62.4% |
| Immigrants | Kuwait | 0.0 /100 | #299 | Tragic 62.4% |
| Immigrants | Africa | 0.0 /100 | #300 | Tragic 62.4% |
| Immigrants | Albania | 0.0 /100 | #301 | Tragic 62.4% |
| Immigrants | Kenya | 0.0 /100 | #302 | Tragic 62.3% |
| Cree | 0.0 /100 | #303 | Tragic 62.3% |
| Iroquois | 0.0 /100 | #304 | Tragic 62.2% |
| Bermudans | 0.0 /100 | #305 | Tragic 62.2% |
| Africans | 0.0 /100 | #306 | Tragic 62.1% |
| Immigrants | Norway | 0.0 /100 | #307 | Tragic 62.1% |
| Chippewa | 0.0 /100 | #308 | Tragic 62.1% |